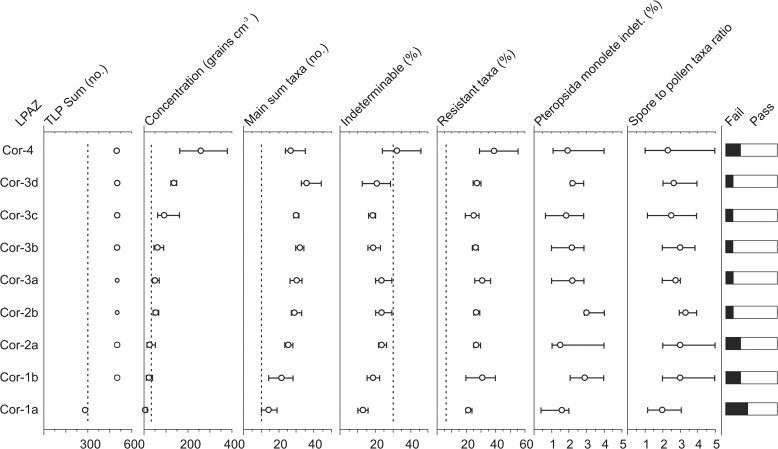
Fig 6. Assessment of the taphonomy of the core based on tests proposed by Bunting and Tipping (2000).
Circles reflect the mean values with error bars indicating the maximum and minimum values for each LPAZ. Dashed lines indicate the tresholds below which samples fail each test expect in the case of Indeterminable percentages where values greater than the threshold indicate failure.

