
Fig 5. Red and green zones for PCa prognosis in 2D plot of MIC-1 and PSA.
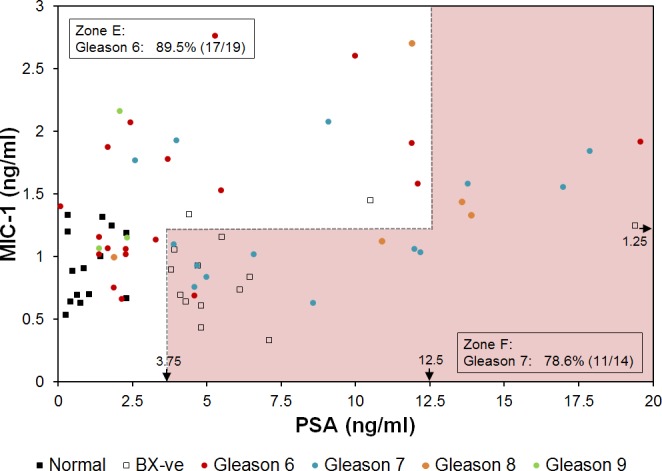
For the ease of presentation, one patient with high PSA concentration of 241.3 ng/ml was not shown. Zone E includes 89.5% (17/19) PCa patients with Gleason score 6. Zone F includes 78.6% (11/14) PCa patients with Gleason score 7. Arrows near the bottom and right edges of the plot indicate the concentrations of biomarkers used to define the zones.