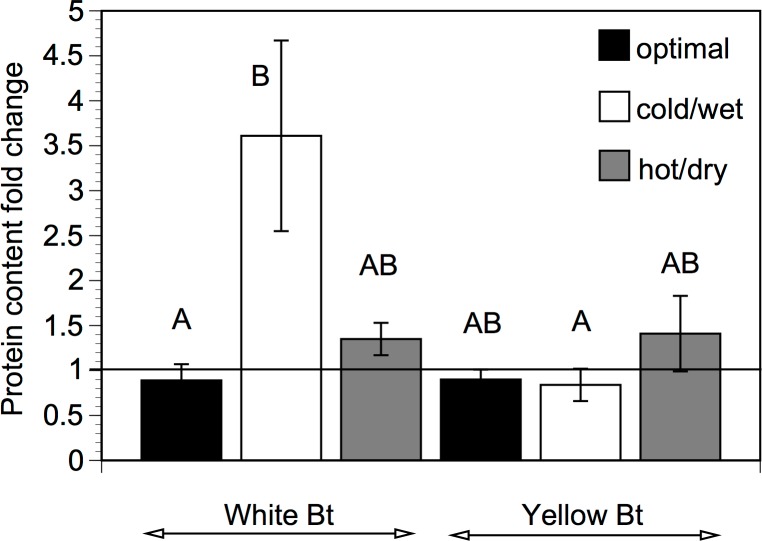
Fig 2. Bt protein content.
Fold change in the Bt protein content in the upper leaves of the white and yellow Bt maize between the first (before stress) and the second (during stress) sampling. Calculated as the ratio of the ‘during stress’ value to the ‘before stress’ value (i.e. 1 = no change). Plants grown under optimal growth conditions were exposed to no stress. The means labelled with the different letters are significantly different at P < 0.05, Tukey’s HSD. Means ± SE, n = 4–5.

