
Fig. 1.
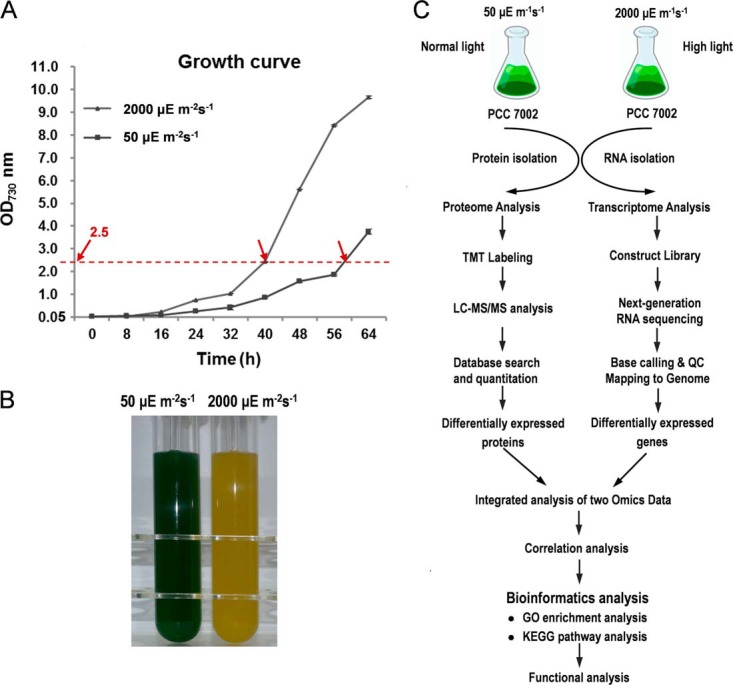
Sampling and scheme for this study. A, Growth curves of Synechococcus 7002 under 50 μEm−2s−1 (NL conditions) and 2000 μEm−2s−1 (HL conditions). Each point represents the mean ± standard deviation (S.D.) of three biological replicates. Arrows indicate time points where samples for RNA-Seq analysis and quantitative proteomics were collected. B, Cultures of Synechococcus 7002 under NL and HL conditions. (C) The overall workflow of this study.