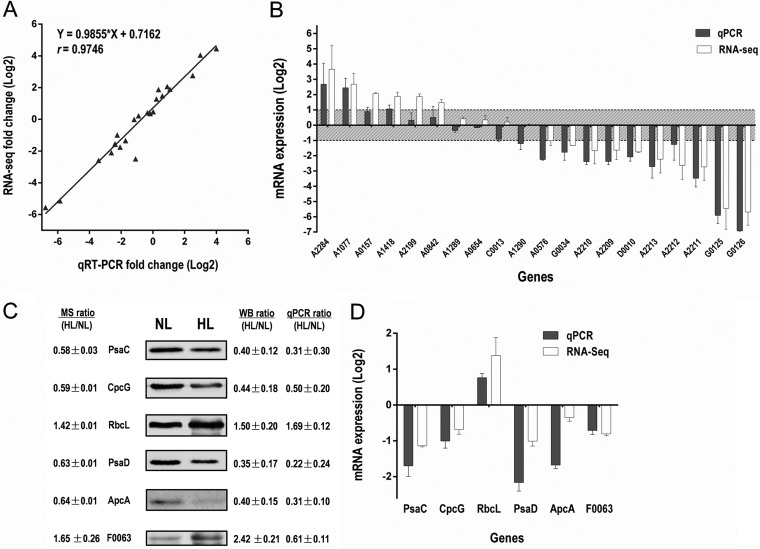
Fig. 2.
Validation of the proteome data and transcriptome data. A, Comparison of log2 expression of 20 selected differentially regulated genes measured by RNA-Seq and qRT-PCR. Positive and negative log2 expression ratios represent up- and down-regulation after HL exposure, respectively. Each data point is calculated from averages of biological triplicates. B, Results derived from RNA-Seq analysis (white bars; n = 2) were compared with those from qRT-PCR (gray bars; n = 3). C, Western blot analysis of protein expression levels of five representative proteins quantified by proteomics after HL exposure. Fold changes of protein levels were determined using Image J software and normalized by protein concentration. D, The mRNA expression level of the validated proteins as detected by qRT-PCR.

