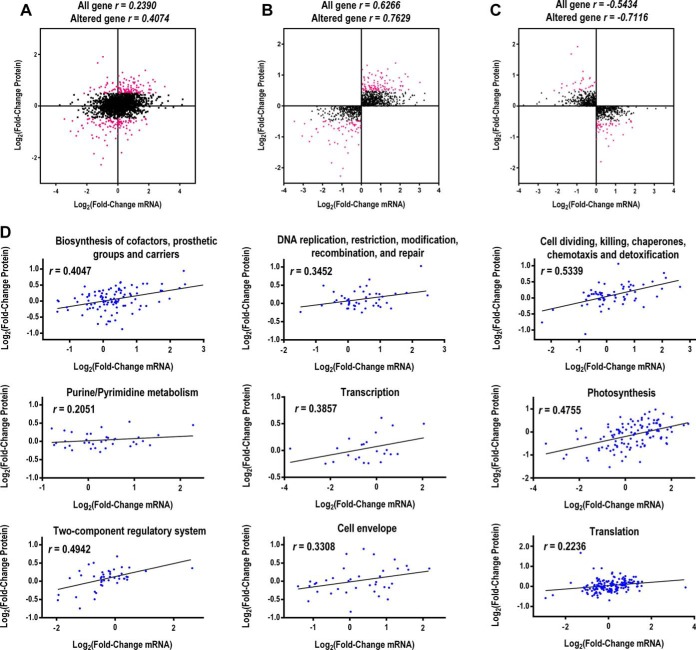
Fig. 3.
Correlations between protein and mRNA expression. A, Scatterplot of the relationship between genes quantified in both transcriptomic and proteomic data sets. Scatterplots and correlation coefficients between proteins and mRNA expression ratios which have the same (B) or opposite (C) changing tendency. The red plot indicates differentially expressed proteins and black plot indicates non-differentially expressed proteins. D, Scatterplots for protein and mRNA expression classified by nine key clusters of GO categories. All mRNA and protein ratios were log2-transformed.

