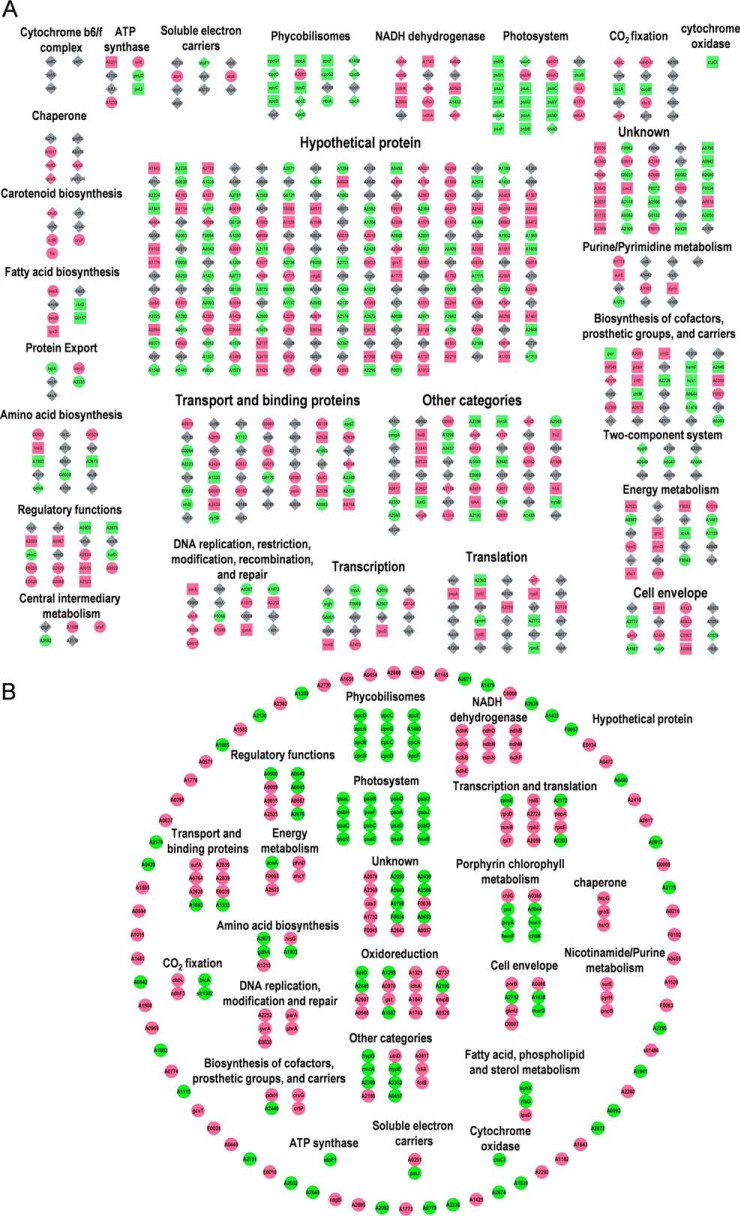
Fig. 4.
Classification of all DEGs and DEPs based on their GO categories. A, Classification of the 526 DEGs and 233 DEPs (64 genes were differentially expressed on both mRNA and protein level) under HL conditions. Circle nodes indicate DEGs that do not have protein quantitative information. Square nodes indicate genes that only differentially expressed on protein level. Diamond nodes indicate DEGs that have protein quantitative information. Red represents up-regulation, green represents down-regulation and gray represents no change in expression. As for genes have both the mRNA and protein quantitative information, the color represents the expression change on protein level. B, Classification of the 233 DEPs under HL conditions. Red represents up-regulation, green represents down-regulation.

