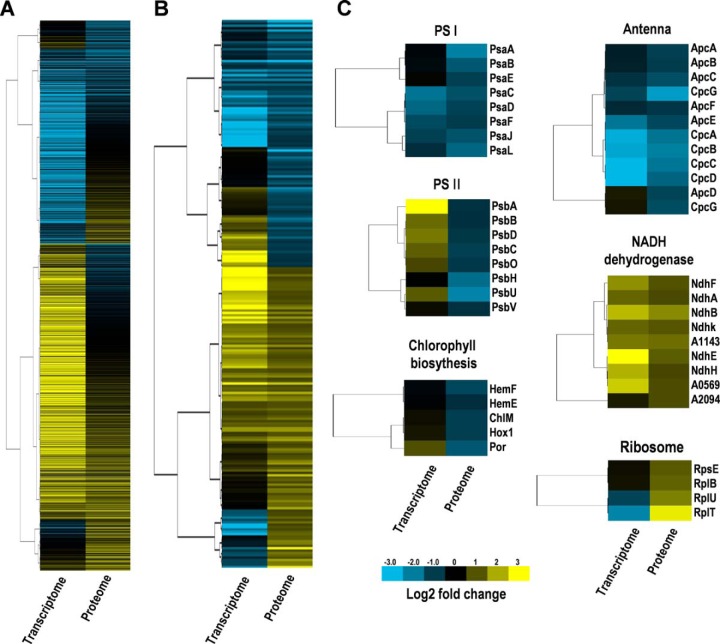
Fig. 5.
Hierarchical clustering analysis of transcriptomic and proteomic data, based on the expression data. A, Heatmap of all the quantified proteins and their corresponding mRNAs. B, Heatmap of all the DEPs and their corresponding mRNAs. C, Heatmap of the gene and protein expression patterns of key genes/proteins in the six functional groups indicated. The heat map is linked by a dendrogram representing clustering of transcriptomic data or proteomic data (left side). The color code is as follows: yellow indicates up-regulated transcripts or proteins; blue indicates down-regulated transcripts or proteins; black indicates unchanged transcripts or proteins. Each row represents the log2 (HL/NL) of a gene or protein. The color scale of the heatmap ranges from saturated blue (value, −3.0) to saturated yellow (value, 3.0) in the natural logarithmic scale.

