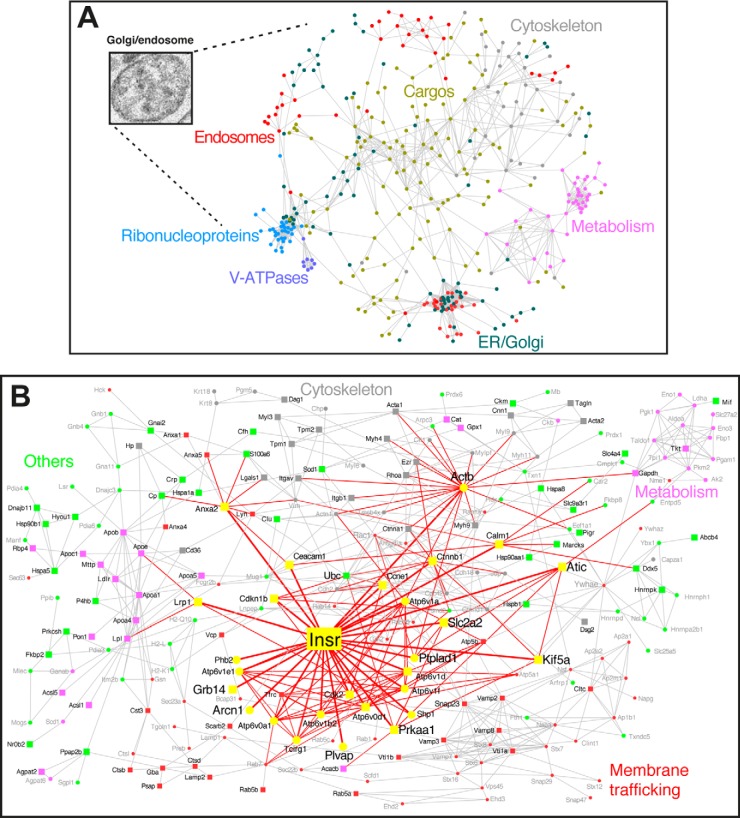
Fig. 1.
Construction of the Golgi/endosome network (GEN) and of the IR subnetwork (IRGEN). A, A set of 666 proteins from the G/E fraction (24) were grouped and linked according to their functional and molecular associations; circles correspond to proteins. A link is placed between proteins if a functional or physical association exists, thus forming the GEN. The color corresponds to the cellular component categorization, as calculated by the Gene Ontology plugin Bingo. B, Projection of IR within the GEN (IRGEN). The colors correspond to the functional class to which the associated protein belongs. Yellow represents the IR and the associated proteins (proteins in magnified fonts were identified in the present study). The width of a link is proportional to the distance from IR. Squares correspond to proteins for which the gene was associated with type 2 diabetes. In the IRGEN, 107 genes (45% of the IRGEN) are associated with type 2 diabetes (supplemental Table S4).

