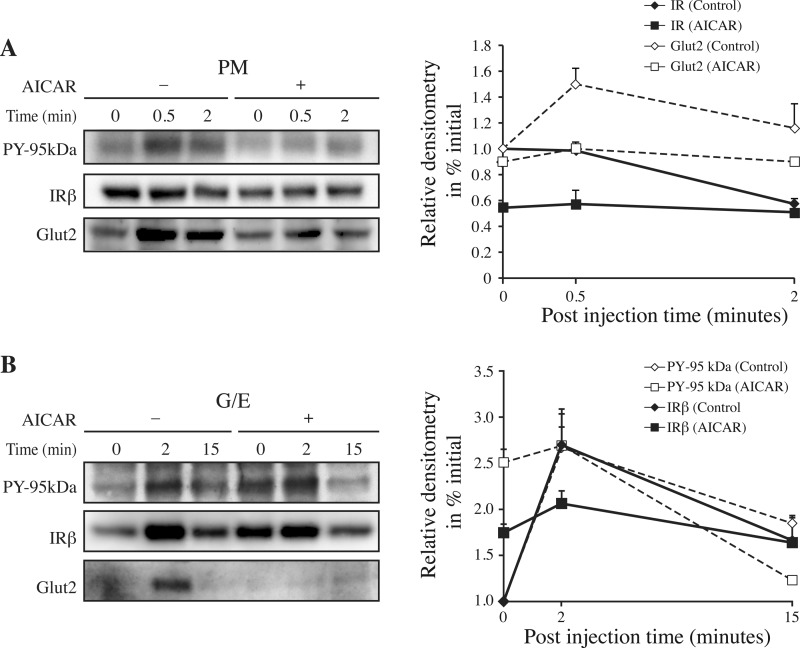
Fig. 6.
Time course for IR internalization in liver after AICAR stimulation. A,The plasma membrane (PM), and B, endosome (G/E) fractions were prepared as described in Fig. 2 except that vehicles (−) or AICAR (10 mg/100 g b.w.) (+) were injected via the jugular vein 15 min before the insulin (1.5 μg/100 g b.w.) injections. Portions of the same membranes (70 μg proteins) were subjected to immunoblot analysis (7.5% resolving gels) with the anti-IR-β subunit (IRβ), anti-PY (PY-20, PY-95 kDa), and anti-Glut2 antibodies. The relative contents of the IR and Glut2 proteins, which are shown in the right panels, were determined by expressing the densitometric data as a percentage of their levels the fractions at time 0, without AICAR. Each point on the progress curve is the mean ± s.d. of three separate experiments.

