
Fig. 1.
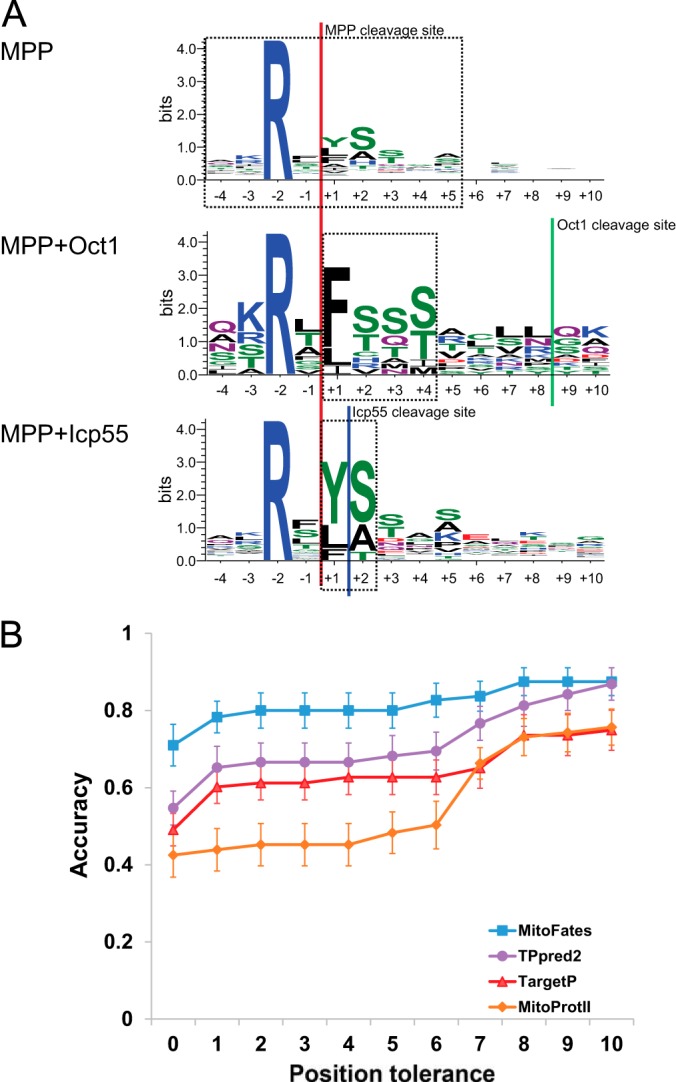
Local sequences and prediction performance of cleavage sites. A, Sequence logo of MPP cleavage sites partitioned into three classes (MPP only, MPP+Icp55, MPP+Oct1) based on recent proteomics data. The dashed line boxes show the range of positions covered by the PWMs for MPP, Oct1, and Icp55. B, Cleavage site accuracy comparison on the yeast data set. Error bars show the standard error of mean estimation based on 10-fold cross validation (only MitoFates is retrained, the other tools are used as distributed without retraining but their prediction accuracy still varies between test folds).