
Fig. 8.
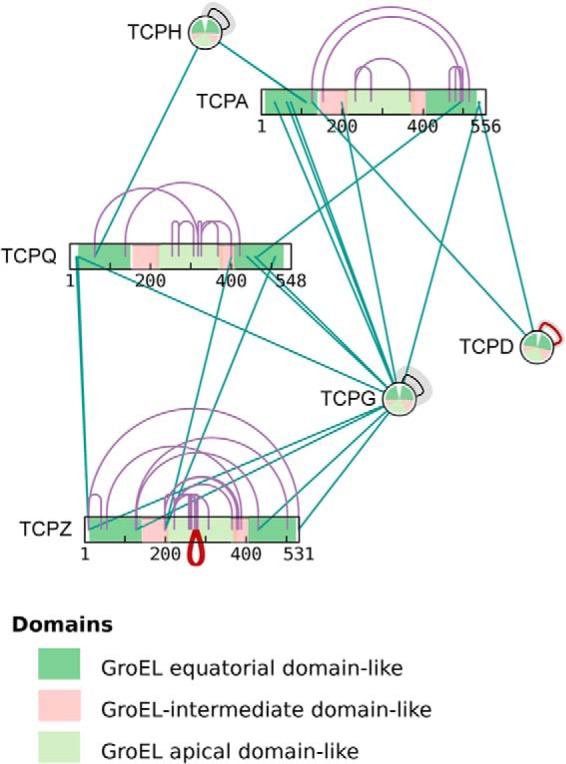
xiNET displays CLMS data in the context of other sequence information. Domains, or other annotated regions, are shown as color-coded segments of the bars or as color-coded sectors of the circles representing proteins. The start and end angles of a sector correspond to the start and end residues of the domain (residue 1 is at 12 o'clock). The data is a subset of the data from Herzog et al. (2). A live example containing the whole dataset can be seen at http://crosslinkviewer.org/figure8.html.