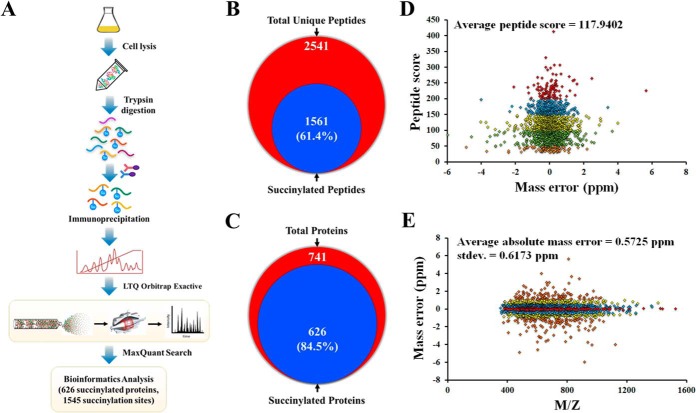
Fig. 2.
Profiling lysine succinylome in Mtb H37Rv. A, Workflow for succinylome analysis of Mtb H37Rv. B, Venn diagram showing the number of identified succinylated peptides. C, Venn diagram showing the number of identified succinylated proteins. D, Distribution of peptide score. E, Distribution of precursor mass deviations.

