Fig. 4.
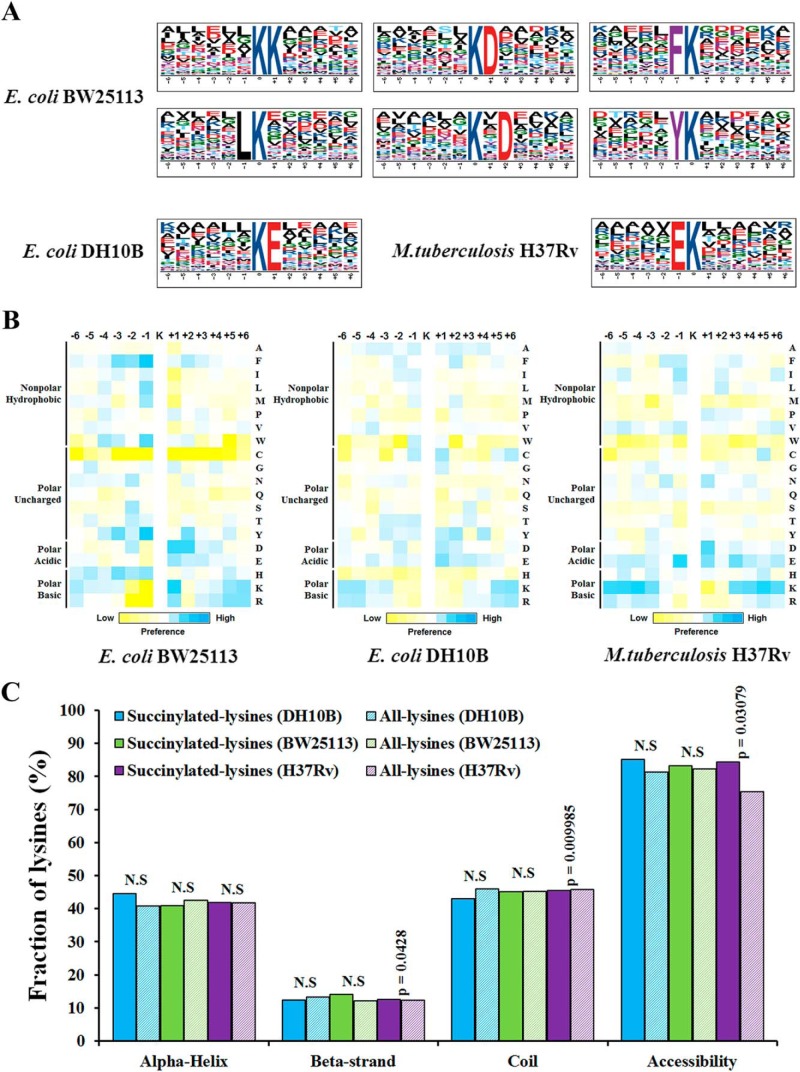
Bioinformational analysis of succinylation sites. A, Sequence Logo representation of significant motifs identified by Motif-X software. The motifs with significance of p < 0.000001 are shown. B, Position-specific under- or over-representation of amino acids flanking the succinylation sites. Colors were plotted by using intensity map and represent the log10 of the ratio of frequencies within succinyl-13-mers versus nonsuccinyl-13-mers (blue shows enrichment, yellow shows depletion). C, Distribution of succinylated and nonsuccinylated lysines in protein secondary structures. Probabilities for different secondary structures (α helix, beta-strand and coil) of succinylated lysine were compared with the secondary structure probabilities of nonsuccinylated lysine on all proteins identified in this study. Significance was calculated by Wilcoxon test.

