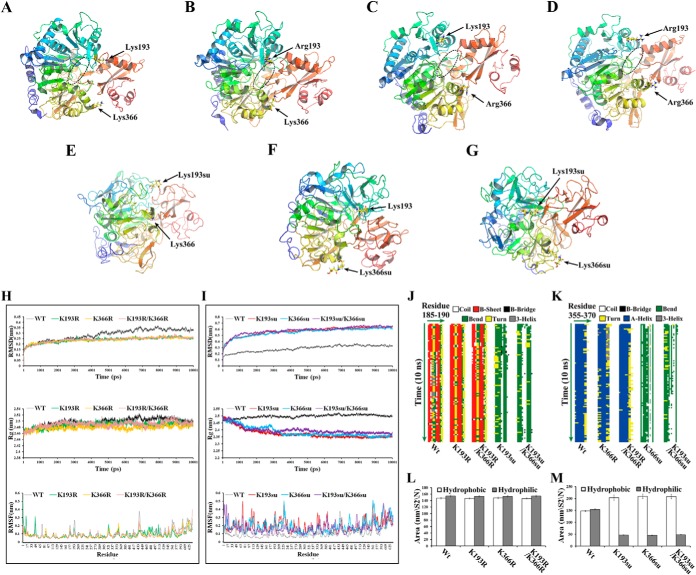
Fig. 8.
Structural modeling of Acs. Final structures of the simulations of Acs were shown. The circular section marks the CoA-binding region A–D. A, Nonsuccinylated (Wt) Acs. Site-directed mutants of B, Acs-K193R; C, Acs-K366R; and D, Acs-K193R/K366R. Acs succinylated at E, K193; F, K366; and G, K193 and K366. H–I, Analysis of the root mean square deviations (RMSDs), root mean square fluctuations (RMSFs) and radius of gyrations (Rgs) for the different Acs systems. (Top) Trajectories of the overall RMSDs of the different Acs systems. (Middle) Radius of gyrations profiles of the different Acs systems. (Bottom) Residue-specific RMSF profiles of the different Acs systems. J–K, Secondary structure evolution of Acs and its mutants. The evolution in secondary structure at each frame was monitored using the dictionary of protein secondary structure (DSSP) algorithm. In the stripes each pixel represents the secondary structure (color-coded) of a residue (185–190 or 355–370, x-dimension) at a given time in simulation (y-dimension). L–M, Time evolution of the solvent accessible surface area (SAS) calculated for the different systems that were simulated.

