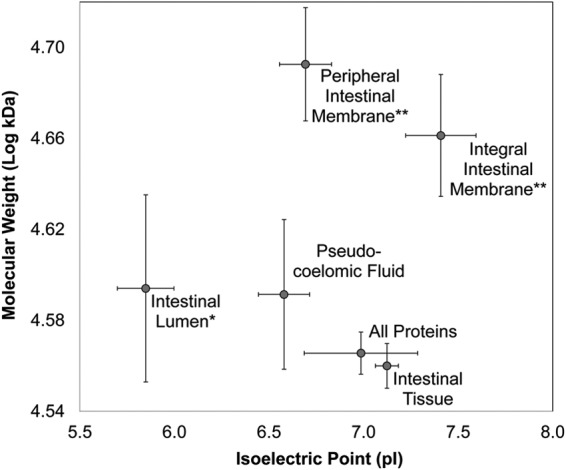
Fig. 3.

The average isoelectric point and molecular weight of the sets of proteins assigned to each intestinal compartment. * and ** = The isoelectric point and molecular weight differ significantly from entire set of detected proteins (respectively). Error bars indicate standard error.
