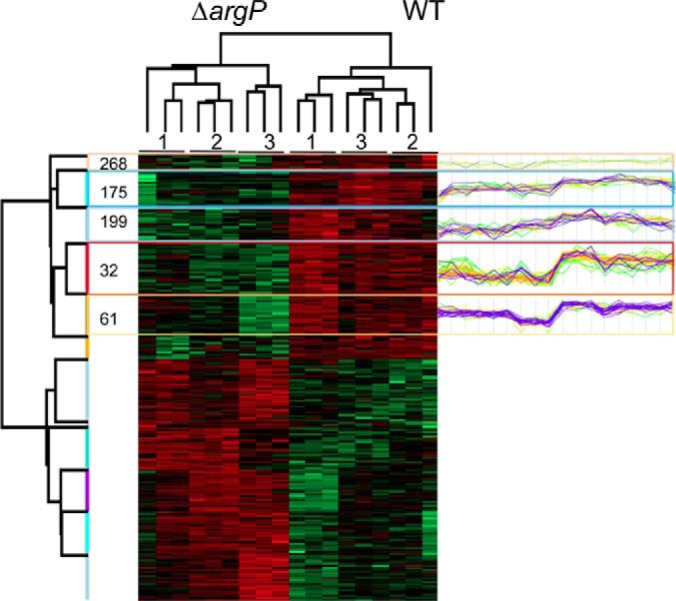
Fig. 3.

Hierarchical clustering and heatmap. Data were obtained by proteomic analyses of wild-type F. novicida and ΔargP mutant strains grown in chemically defined medium (CDM) containing a limiting concentration of arginine (0.46 mm). Samples were collected at 2 h of growth. For each strain, ΔargP mutant or wild-type (WT), three biological replicates were performed (indicated as 1, 2, 3, on top of the figure) and each replicate was tested in triplicate. 842 proteins with quantification values across samples were analyzed. 309 proteins whose amount significantly differed between the two strains were submitted to bi-clustering analysis and represented in the heat-map. The column tree shows that the protein profiles of the wild-type strain and of the ΔargP mutant were different. The proteins belong to two categories: (1) proteins present in lower amounts in the ΔargP mutant (141 proteins, in green); and (2) proteins present in higher amounts (168 proteins, in red). Five protein clusters (268, 175, 199, 32, 61), containing ribosomal proteins, are represented as profile plots to the right of the figure (highlighted in blue). For a detailed list of proteins, see supplemental Table S1.
