
Fig. 5.
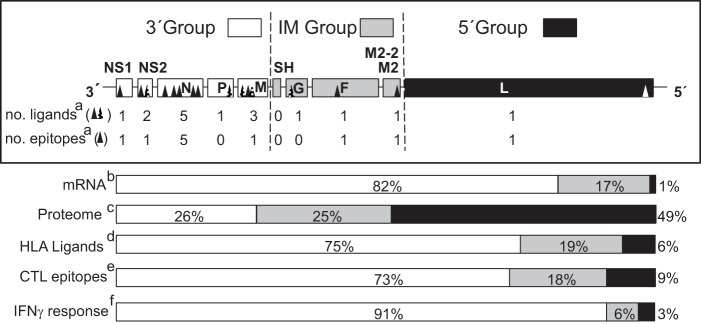
HLA class I ligands identified by mass spectrometry and their relation with the HRSV genome, mRNA, proteome, and T-cell immune response. Schematic representation of the HRSV genome indicating the three different transcription groups (3′, intermediate or IM, and 5′) encoding viral proteome separated by dotted lines. The abbreviations used for viral proteins were NS1 (Nonstructural protein 1), NS2 (Nonstructural protein 2), N (Nucleoprotein), P (Phosphoprotein), M (Matrix protein), SH (Small hydrophobic protein), G (Glycoprotein), F (Fusion protein), M2–2 (Matrix protein 2), and L (Polymerase). For each transcription group the number of HLA class I ligands identified by mass spectrometry in this report and studies (17, 18) together with the number of HLA class I epitopes identified in this report are shown in a, the transcription gradient, which was measured as the mRNA molar ratio percentage (11, 53, 54) is shown in b, the proteome percentage is shown in c, the HLA class I ligand percentage from the total is shown in d, the CTL epitope percentage from the total is shown in e, and the total IFN-γ+ immune response percentage detected in the HLA class I-transgenic mice is shown in f.