
Fig. 7.
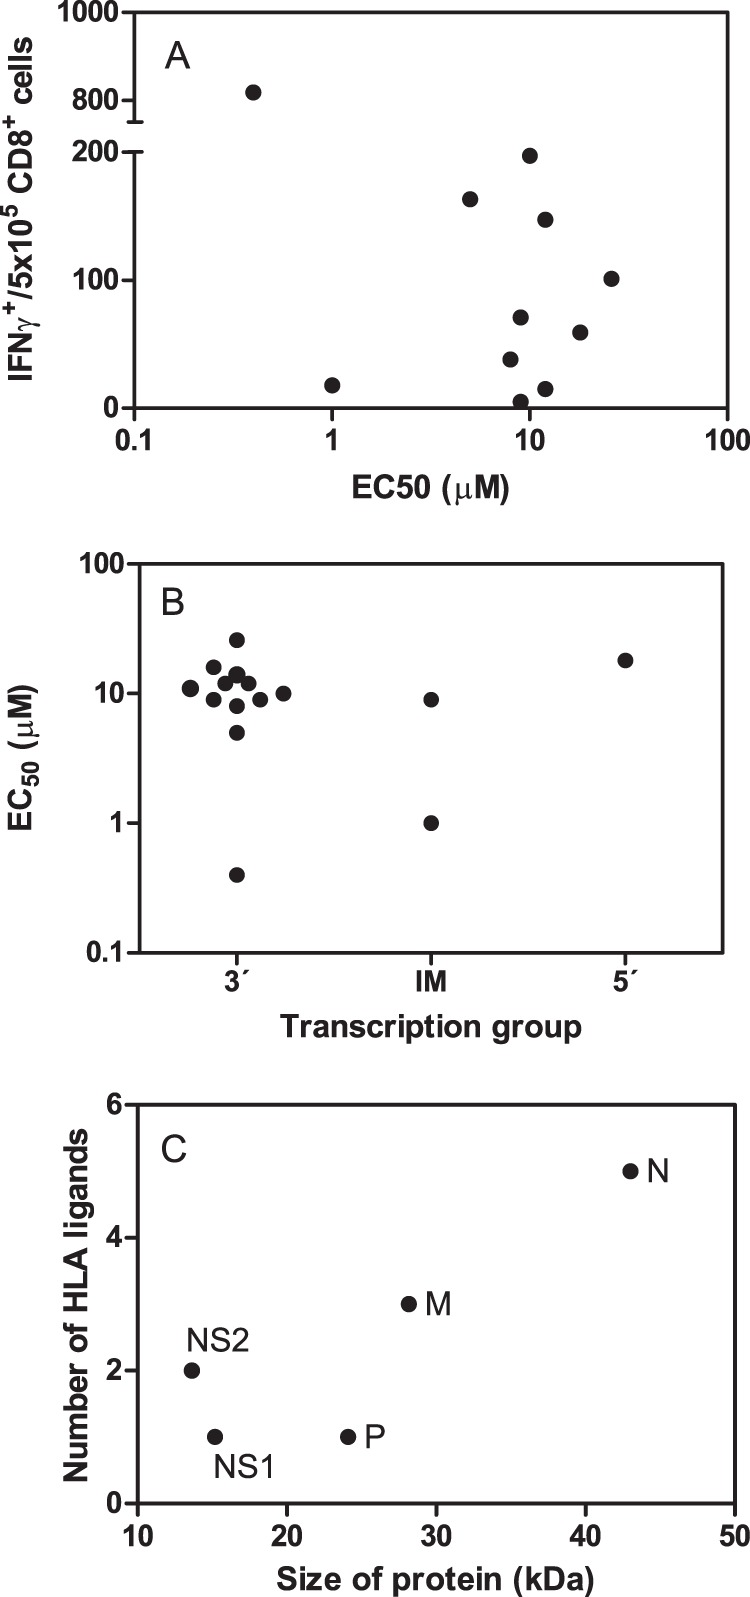
Comparison between HLA binding affinities and T-cell responses for the HLA class I ligands identified by mass spectrometry. A, the HLA binding affinity versus immunogenicity for the synthetic HRSV ligands was represented as Dot plot that represents the HLA binding affinity, which is expressed as EC50 from Table 2, versus the INFγ+ T-cell response from Fig. 6. B, The HLA binding affinities, which are expressed as EC50 from Table 2, of the different synthetic HRSV ligands that are grouped by transcriptional groups defined as indicated in Fig. 5 are shown. C, Dot plot represents the number of HLA class I ligands versus the size of the five HRSV proteins that were encoded by the 3′ transcription group.