
Fig. 2.
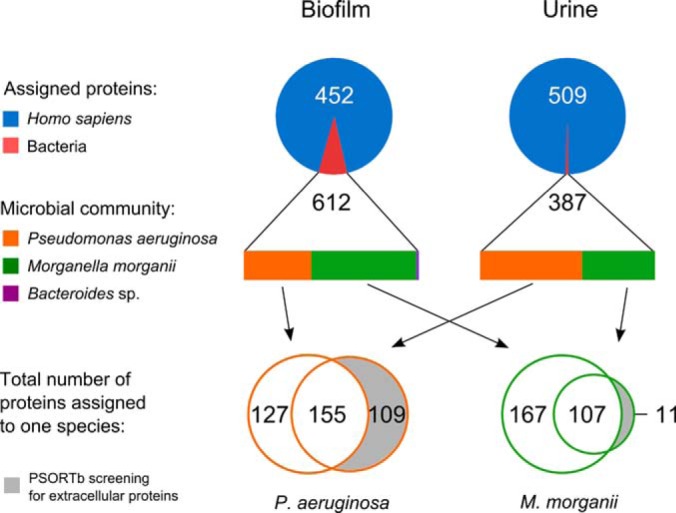
Taxonomic distribution of assigned proteins resulting from the metaproteomic analysis of the catheter-associated biofilm and urine of a long-term catheterized patient. Numbers indicate the assigned proteins per sample (average of three technical replicates), the chart area displays the quantitative distribution (NAUC values) of the assigned proteins to the kingdom or the species level.