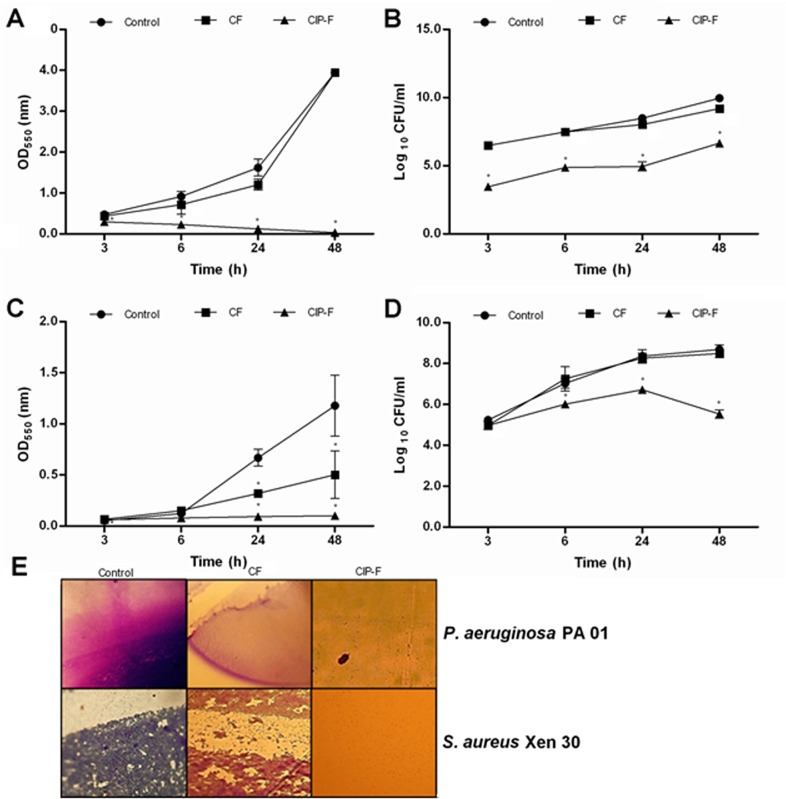
Fig 4. A and C: Biofilm formation recorded for P. aeruginosa PA01 and C: S. aureus Xen 30, respectively.
Biofilm formation is expressed as optical density of crystal violet-stained cells. B and D: viable cell numbers recorded for P. aeruginosa PA01 and C: S. aureus Xen 30, respectively. E: Biofilm images recorded with a light microscope. CIP-F = nanofibers containing ciprofloxacin (CIP), CF = nanofibers without CIP, control = no nanofibers and no CIP. Data points presented are the average of three independent experiments (mean ± standard deviation). * p < 0.05.

