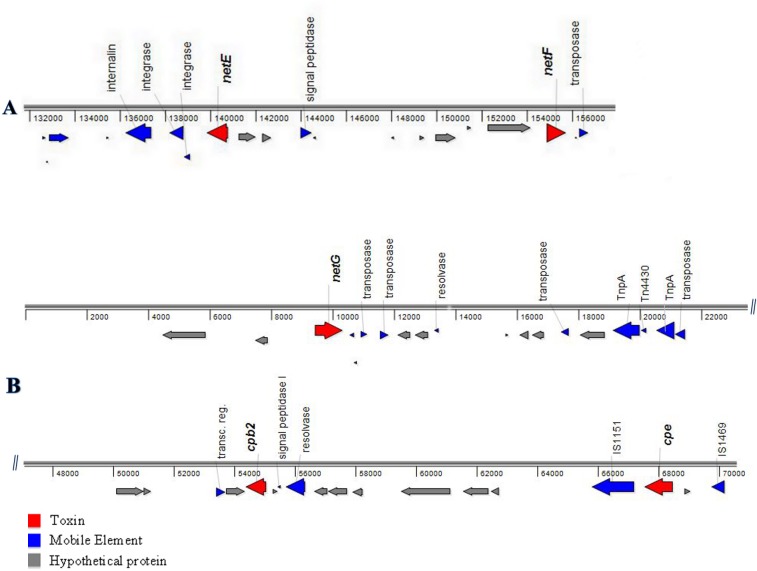
Fig 1. Genetic organization of JFP718 scaffolds.
The genetic organization of (A) partial view of scaffold00006 (GenBank KP739975), (B) partial view of scaffold00012 (GenBank KP739976) is shown, each arrow representing a predicted gene and its orientation. Predicted functional annotations and respective positions are shown above each gene, respectively. Genes are color-coded by their putative role based upon sequence analyses.

