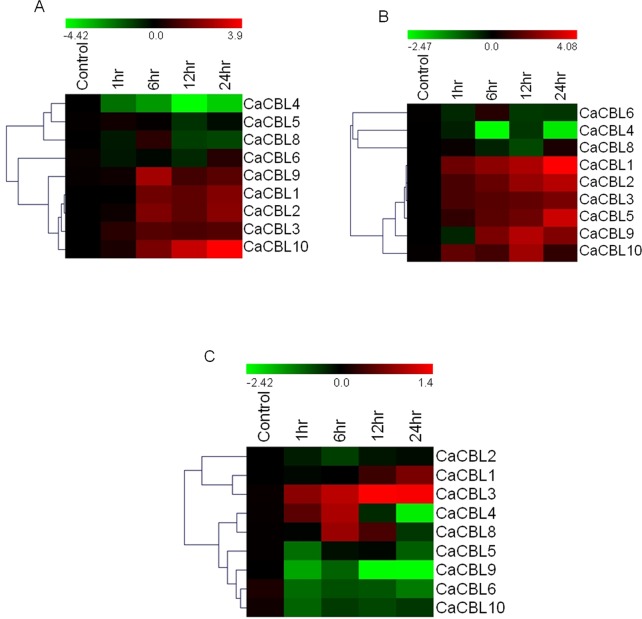
Fig 5. Relative transcript levels of chickpea CBL genes in response to different abiotic stress treatments.
6 day-old chickpea seedlings were exposed to 250 mM NaCl (A), 20% PEG (B) and Cold at 4°C (C) and samples were harvested at different time interval as mentioned for relative expression studies by qRT-PCR and presented as heatmap. The scale bar represents relative expression values. Hierarchical clustering has been represented at left. Relative fold expression values are presented as bar diagram in S4 Fig.

