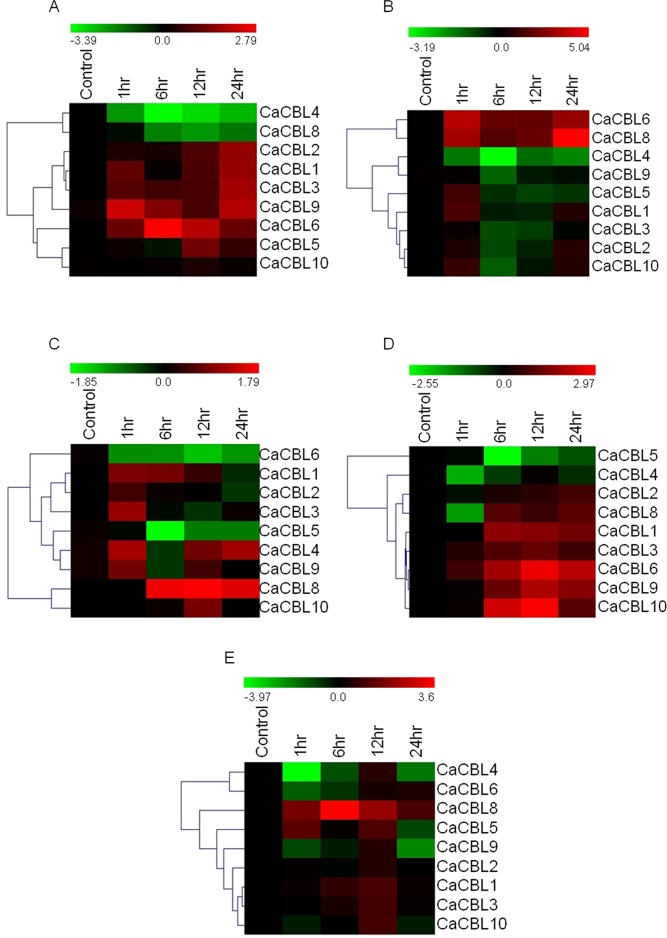
Fig 6. Relative transcript levels of chickpea CBL genes in response to treatment with various phytohormones.
Expression profiles of CBL genes in chickpea seedlings exposed to Abscisic acid (A), BAP (B), IAA (C), Salicylic acid (D) and Methyl Jasmonate (E) for different period by qRT-PCR and presented as heatmap. The scale bar represents relative expression value. Hierarchical clustering was played in data analysis. Relative fold expression values are presented as bar diagram in S4 Fig.

