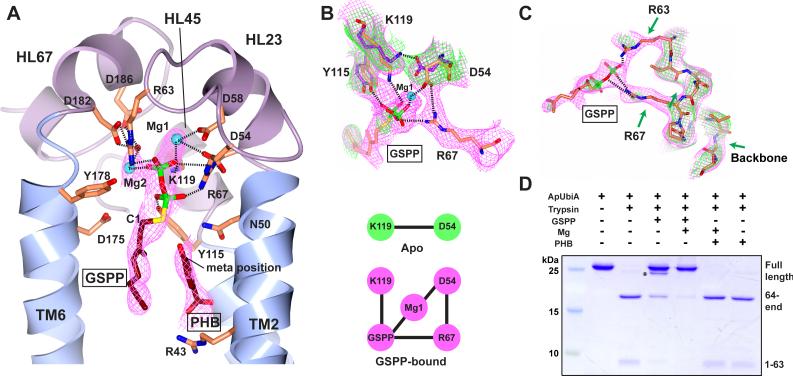
Figure 2. Substrate binding of ApUbiA.
(A) The ApUbiA structure in complex with the substrates. The B-factor sharpened experimental map (in purple) is contoured at 1σ. Due to the limited resolution, the interactions (dashed lines) between individual atoms are putative. (B) Conformational changes induced by GSPP binding. Top: the experimental maps (1σ) of the apo (green) and GSPP-bound (purple) structures suggest the change of interactions. Bottom: a cartoon shows that an interaction network is established upon GSPP binding. (C) Comparison ofthe loop region near Arg63 and Arg67 (same maps as in B). The green arrows indicate a few disordered regions in the apo-structure. (D) Trypsin digestion of the ApUbiA protein in presence of GSPP, PHB, and Mg. The primary digestion site is at Arg63 and a minor digestion site (asterisk) is in a linker region of the N-terminal His-tag.

