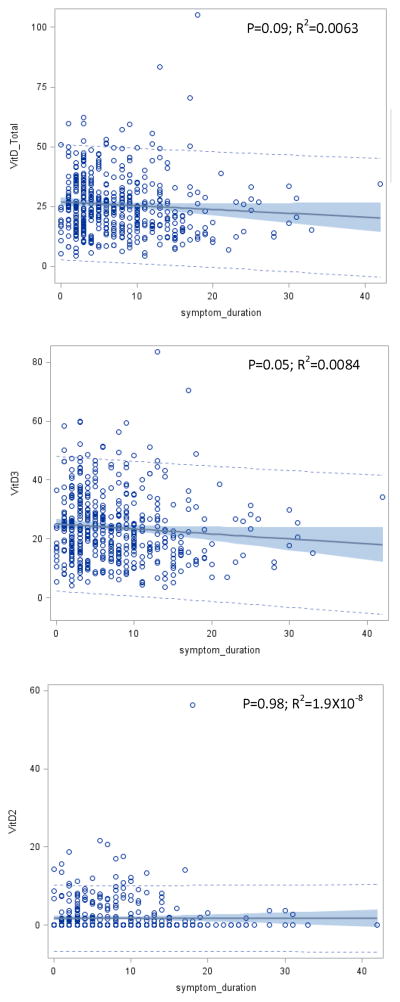
Figure 1. Correlation between vitamin D from different source with symptom duration.
Correlation between total vitamin D (upper panel), 25(OH)D3 (middle panel) 25(OH)D2 (lower panel), and Parkinson symptom duration are displayed. X-axis displays symptom duration in years, and Y-axis displays plasma vitamin D levels. Solid line represents fitted correlation between vitamin D levels and symptom duration, shadows represent 95% confidence of the fitted correlation, and the dotted lines represent the predication limits of the fitted correlation.

