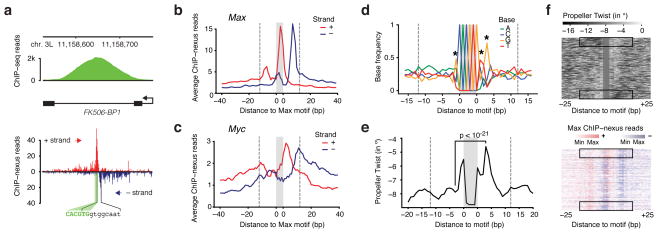
Figure 4. Favored interaction side of Max at E-Box motifs correlates with DNA features in the flanking sequences.
(a) Single-gene examples of the ChIP-nexus footprints show that the Max profile indeed consists of two separate footprints, one of which is frequently dominant. For example, in the Fk506-BP1 intron, the Max footprint (black brackets) is found to the right of the E-box motif (green). (b) Average Max ChIP-nexus profile at the top 200 CACGTG motifs after orienting each footprint such that the higher signal is to the right. The area of the motif is shaded in grey and the extended area of the footprint is demarcated with dotted lines from the motif (at 12 bp away from the motif to include most reads from the footprint). (c) Average Myc ChIP-nexus profile at the same motifs shown in (b) shows that Myc’s footprint is generally localized to the same side of the motif as Max. (d) Average base composition of the oriented E-box motifs from (b). Significant differences in nucleotides within the area of the footprint are marked with a star (Chi2 test, p < 10−24 for the G to the right and p < 10−12 for all others). The consensus sequence for orientation to the right is RCACGTGYTG. (e) The oriented sequences also show a marked difference in predicted DNA shape, notably the propeller twist score between a base pair (measured in degrees of rotation). At the third position from the motif, the difference is the highest (paired t-test, p<10−21). Note that on the favored interaction side, the predicted propeller twist is more neutral (seen as peak due to the negative scale). (f) Differences in DNA propeller twist in regions flanking the E-box motif correlate with Max ChIP-nexus footprint level. In the upper panel, the top 200 motifs were ordered by the difference in the mean DNA propeller twist measurements within the 6 bp flanking the E-box on both sides. The Max ChIP-nexus heatmap with the same order of motifs (lower panel) shows that the favored interaction side is most pronounced when there is an asymmetry in the DNA propeller twist around the motif (black boxes).

