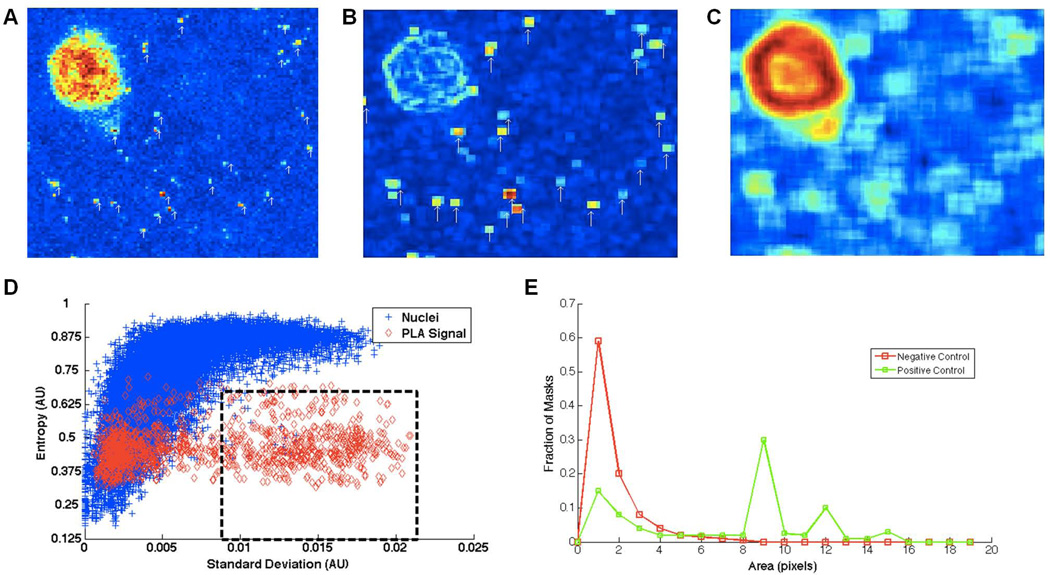
Figure 4. Software-guided image analysis method for selecting PLA-generated dots.
(A) Heat map of the fluorescence intensity values in an unfiltered image. Before any transformation of the image is performed, both the nuclei and the PLA signal exhibit high intensity fluorescence. White arrows point to putative PLA-generated dots. (B) To elevate isolated areas of high fluorescence intensity, a standard deviation filter is employed. White arrows highlight areas that have high standard deviation and low entropy. (C) To locate edges of nuclei the image is entropy filtered. Nuclei are then filled inward to specify their location. (D) The entropy and standard deviation of all pixels within user-selected dots (red) and user-selected nuclei (blue) illustrates that nuclei and PLA-generated dots can be distinguished on the basis of differential clustering in this parameter space. (E) Using the thresholds from “D” (standard deviation = 0.009, entropy = 0.65) to gate (perforated box) only PLA dots for further analysis, masks are produced for each individual image from each experimental condition. In our analyses, masks smaller than 8 pixels were counted as noise, while those over 8 pixels were counted as positive PLA-generated signal. See Materials and Methods for more details regarding this method.

