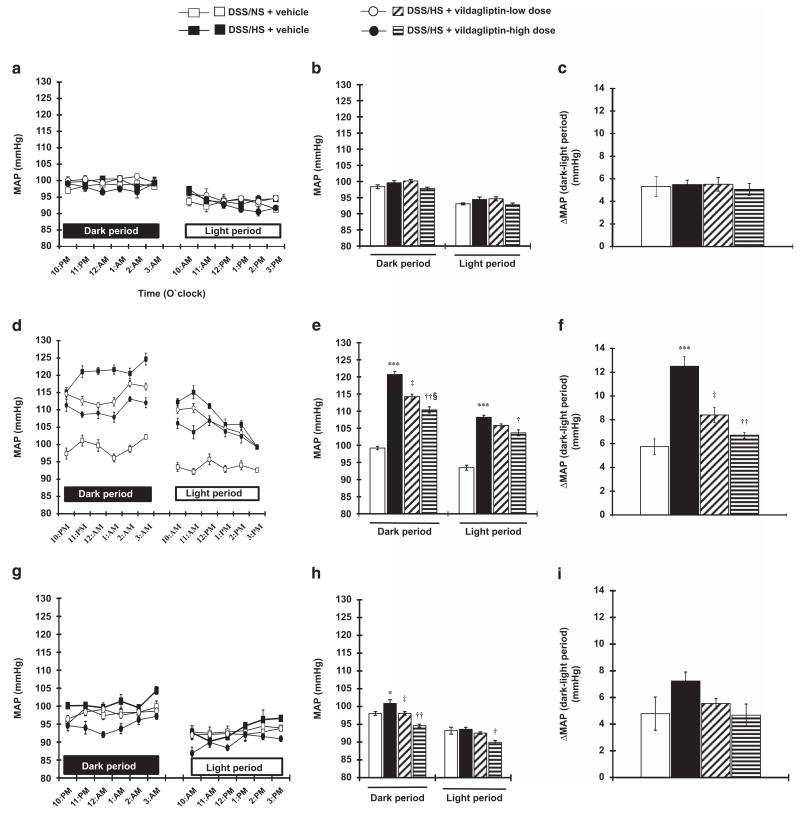
Figure 2.
Circadian rhythms of the mean arterial pressure (MAP) measured hourly by the telemetry system in Dahl salt-sensitive (DSS) rats. At baseline MAP in DSS rats with NS diet (a), the MAP during the dark and light periods (b) and differences in MAP between the dark and light periods (c). Baseline MAP during normal salt (NS) diet treatment is higher in the dark period compared with the light period, indicating that the animal has circadian dipper pattern of blood pressure (BP). (d–f) Hourly MAP in DSS rats with high-salt (HS) diet. After 1 week of HS diet treatment, the MAP is increased (d). Averaged value of dark and light periods (e) and differences between the dark and light periods (f) are shown. DSS rats with HS diet feeding for 7 days show greater increases in MAP in the dark period compared with the light period, suggesting that DSS rats have an extreme dipper pattern of BP. Vildagliptin treatment dose-dependently attenuated these changes in BP. (g–i) Hourly MAP in DSS rats after switching to NS diet. After 1 week treatment of NS diet, the MAP is decreased (g). The mean values of the dark and light periods (h) and differences between the dark and light periods (i) are shown. After switching from HS diet to NS diet, the animals demonstrated a normal BP dipper pattern. ***P<0.005 NS+vehicle vs. HS+vehicle; †P<0.05, ††P<0.01 HS+vehicle vs. HS+vildagliptin-high dose; ‡<0.05 HS+vehicle vs. HS+vildagliptin-low dose; §P<0.05 HS+vildagliptin-low dose vs. HS+vildagliptin-high dose.

