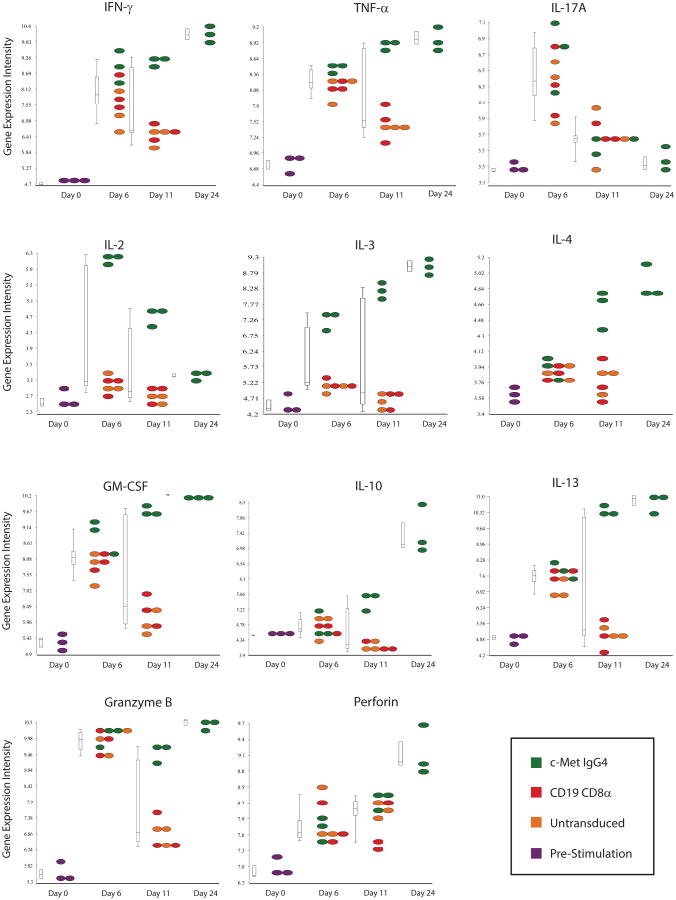
Figure 3. CARs with a constitutive growth phenotype display a unique gene signature.
Cytokines, perforin and granzyme expression. Microarray analysis comparing cytokine expression of c-Met IgG4 (green), CD19 CD8-α (red), CART19 (blue) CARs and untransduced (orange) T cells at baseline and on days 6, 22 and 24 of culture; only the c-Met IgG4 culture was analyzed on day 24 because the other cultures were terminated due to cell death. No exogenous cytokines were added to the culture media. Normalized absolute log2 gene expression intensities are plotted for IFNγ, TNFα, IL17A, IL2, IL3, IL4, GM-CSF, IL10, IL13, Granzyme B and Perforin, The design of the CAR constructs is shown in Supplemental Figure S1.

