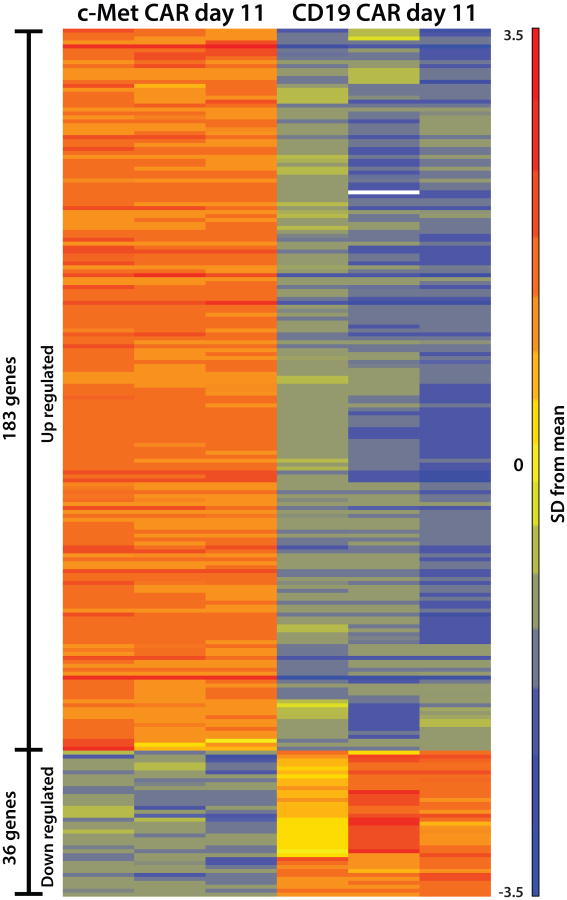
Figure 5. Heat map showing relative intensities of the differentially expressed genes in CD4+ T cells expressing continuous CARs or non-continuous CARs.
The differentially expressed genes with a 5-fold cutoff in CD4+ cells from 3 healthy donors are shown for c-Met IgG4 CAR and CD19 CD8α CAR on day 11. The expression level of each gene is represented by the number of standard deviations above (red) or below (blue) the average value for that gene across all samples. The list of the differentially expressed genes is shown in Supplemental Tables S2 and S3. The design of the CAR constructs is shown in Supplemental Figure S1.

