Figure 3.
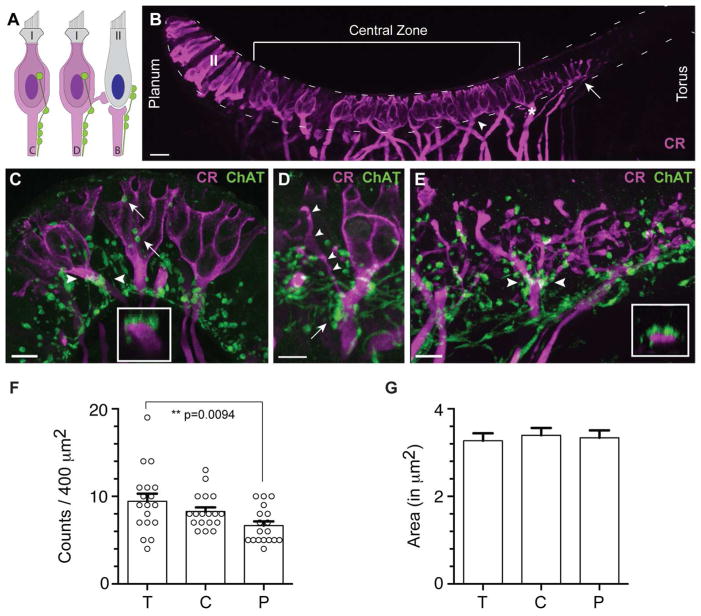
ChAT-positive varicosities are found abutting afferent fibers in the turtle crista. A. Illustration depicting locations of efferent terminals on calyx (C), dimorphic (D), and bouton (B) afferents. Efferent terminals on a type II hair cell are also shown. B. Confocal image projection of a longitudinal section of a turtle hemicrista stained with antibodies to calretinin (magenta). Anti-calretinin labeled calyx afferents (arrowhead), dimorphic afferents (asterisk), bouton afferents near the torus (arrow), and type II hair cells near the planum (II). Dashed lines border the hair cell layer from the planum to the torus. C. Confocal image projection of a transverse section through the central zone of a turtle hemicrista showing ChAT-positive varicosities (green) clustered along the axonal stalk of calretinin-positive calyx afferents (magenta). Inset: Orthogonal view generated for the calyx afferent bracketed by arrowheads demonstrating the proximity of ChAT-positive varicosities to the parent fiber. ChAT-positive varicosities are also identified along segments of the calyceal expansion (arrows). D. ChAT-positive varicosities (green) are similarly distributed on the axonal stalk (arrow) of a calretinin-positive dimorphic afferent (magenta). Bouton offshoot of dimorphic afferent indicated by arrowheads. E. A confocal image projection of bouton afferents near the torus was taken from a longitudinal section of the turtle crista stained with antibodies to calretinin (magenta) and ChAT (green). Inset: Orthogonal view (between arrowheads) indicates the proximity of varicosities to the bouton afferent fiber just prior to a branch point. Scale bar = 20 μm in all panels. F. ChAT-positive varicosities were counted across the zones of the turtle crista (T=torus, C=central, P=planum). Average counts from torus and planum regions were significantly different (p<0.01) while neither torus nor planum were significantly different from the central zone. Circles indicate mean counts for each 20μm × 20μm area sampled (n=18). G. Mean ChAT varicosity areas were also calculated and found to be similar across all three zones. Error bars = SEM.

