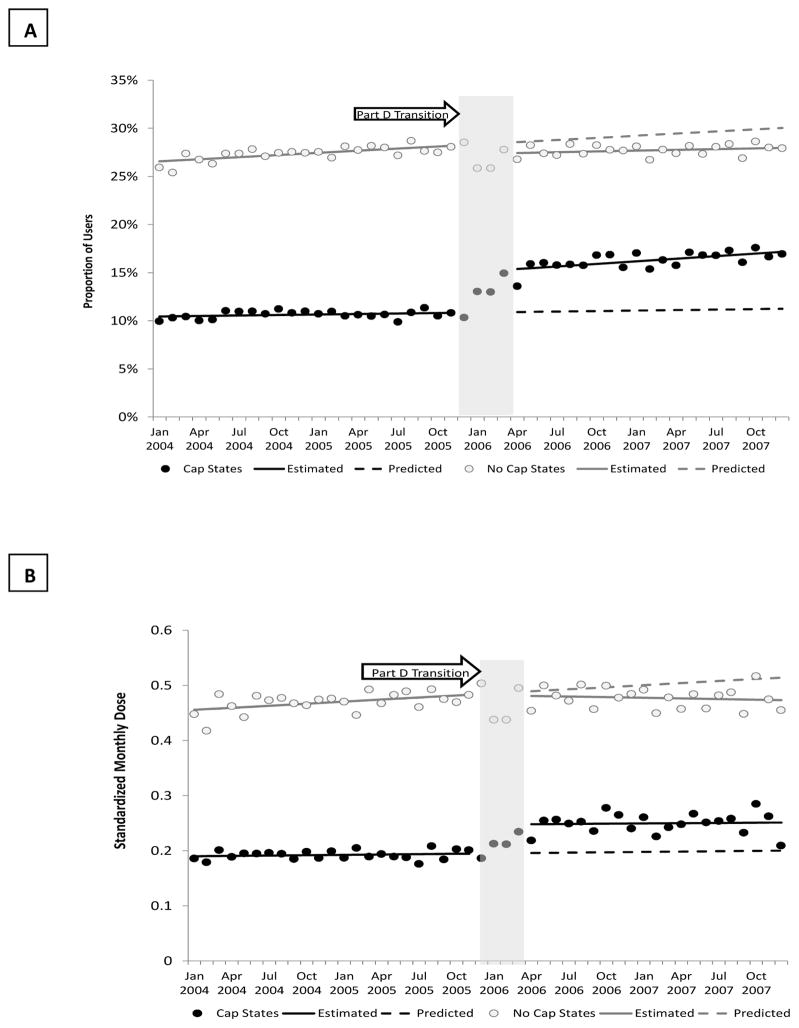
Figure 2. Changes in the Prevalence of Antidepressant Use Before and After Part D by Drug Cap Status*.
*Monthly Prevalence (A) and Intensity of Antidepressant Use (B) Before and After the Transition from Medicaid to Part D among Dual Enrollees with Diabetes and Co-Morbid Major Depression in Strict Drug Cap Compared to No Drug Cap States; Solid black circle=observations in drug cap states; solid black line=estimated utilization in drug cap states from time series models; Black dashed line=predicted utilization in drug cap states based on baseline trends; Open grey circle=observations in non-drug cap states; solid grey line=estimated utilization in non-drug cap states from time series models; Black dashed line=predicted utilization in non-drug cap states based on baseline trends

