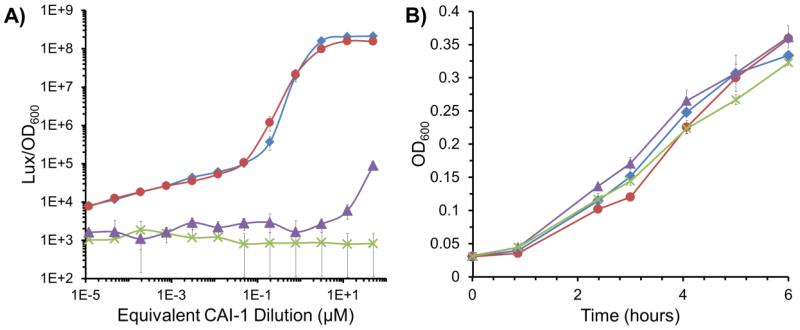
Figure 5.
Bioactivity of CAI-1 nanoparticles. (A) Bioluminescence response of V. cholerae WN1102 supplemented with different amounts of CAI-1 NPs in PBS ( ), CAI-1 in DMSO (
 ), CAI-1 in PBS (
 ), or VitE NPs in PBS (
 ). Concentrated CAI-1 NPs in PBS and CAI-1 in DMSO were added to cell cultures to the final concentrations indicated. CAI-1 in PBS and VitE NPs in PBS were equivalently diluted and added to cell cultures. (B) Growth of V. cholerae ultures at 37°C. CAI-1 NPs in PBS and CAI-1 in DMSO were added to cell cultures to a final CAI-1 concentration of 50 μM. CAI-1 in PBS, and VitE NPs in PBS were equivalently diluted and added to cell cultures. In both panels, values are averages and error bars are standard deviations of three separate measurements.

