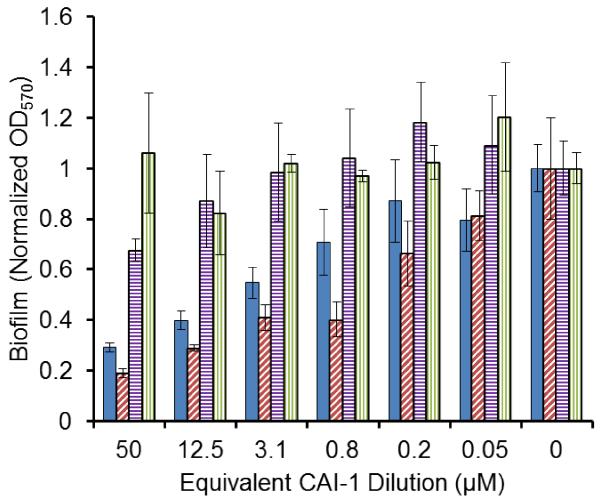
Figure 6.
Biofilm inhibition using CAI-1 NPs. Crystal violet colorimetric analysis of adherent cells when V. cholerae was grown with supplemented CAI-1 NPs in PBS ( ), CAI-1 in DMSO (
 ), CAI-1 in PBS (
 ), or VitE NPs in PBS(
 ). Values are averages and error bars are standard deviations of four separate measurements.

