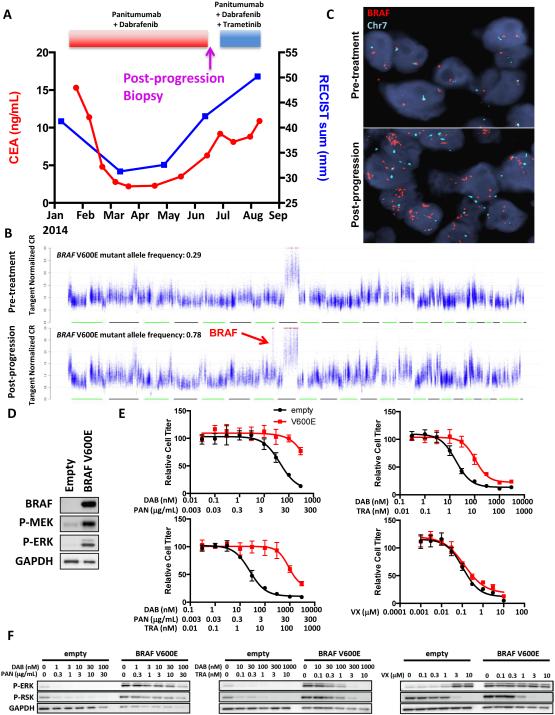
Figure 3. BRAF amplification causes clinical acquired resistance to combined RAF/EGFR inhibition.
(A) Clinical time course of therapy for BRAF-mutant CRC patient #2 showing dates of therapy and timing of post-progression biopsy. CEA tumor marker levels and cumulative tumor diameter as measured by RECIST are shown throughout the treatment course. (B) DNA copy number traces are shown for the post-progression biopsy compared to a pre-treatment biopsy taken from the same lesion immediately prior to the start of panitumumab + dabrafenib therapy. Focal amplification of BRAF on chromosome 7 is shown in the post-progression biopsy. BRAF V600E mutant allele frequencies are shown for each sample. (C) FISH was performed on the pre-treatment and post-progression biopsies using probes for BRAF (red) and chromosome 7 (Chr7; green). (D) VACO432 cells overexpressing BRAF V600E compared to empty vector were lysed, and western blotting was performed with the indicated antibodies. (E) Cells from (D) were treated for 72h with the indicated concentrations of dabrafenib (DAB), panitumumab (PAN), trametinib (TRA), or VX-11e (VX) for 72h and relative cell titer was determined. (F) Cells from (D) were treated for 24h with the indicated concentrations of drugs, and western blotting was performed with the indicated antibodies.

