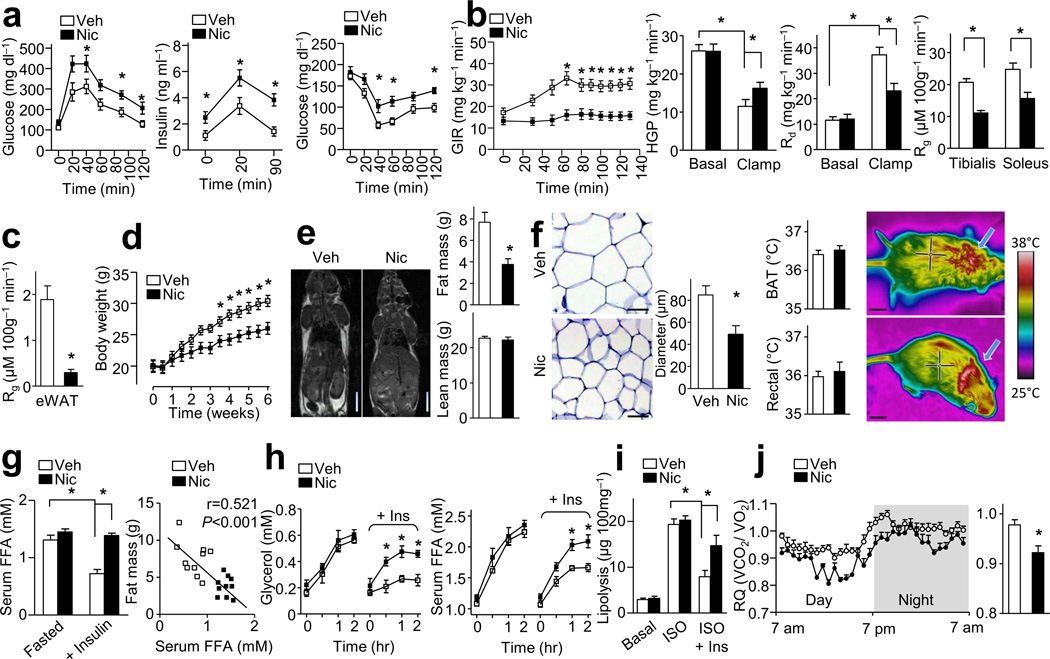
Figure 1.
Nicotine (Nic) perfusion induces IR and lower adiposity. (a) IPGTT, insulin release, and ITT; n = 10–11 each. (b,c) Hyperinsulinemic-euglycemic (H-E) clamp. Glucose infusion rate (GIR), hepatic glucose production (HGP), the rate of the disappearance (Rd) and the glucose metabolic index (Rg) in tibialis anterior and soleus (b) or epididymal white adipose tissue (eWAT, c); n = 9 each. (d) Body weight changes; n = 11 each. (e) Representative MRI images (n = 4 each) for fat distribution, fat mass and lean mass (n = 11 each). Scale bars, 1 cm. (f) Representative eWAT sections (n = 10 sections each) and quantification of adipocyte diameter (Scale bars, 50 µm, n = 10 each), and temperature of brown adipose tissue (BAT) area and rectal temperature (n = 10 each) with representative infrared thermal images (Scale bars, 1 cm). (g) Serum FFA after overnight fasting or insulin perfusion at 40 min during ITT (n = 10 each), and the linear regression between fat mass and serum FFA levels during insulin perfusion (n = 10 each). (h) In vivo lipolysis. (n = 8 each). (i) In vitro lipolysis assay of isolated adipocytes; n = 7 each. (j) Respiratory quotients (RQ, VCO2/VO2) (left) and the average data (right). n = 10 each. Significance determined by one-way ANOVA with repeated measures for the inter-assay evaluations (a,b,d,h), Student’s t-test (c,e,f,j), one-way ANOVA with Bonferroni’s post-hoc test (g,i) and *P < 0.05. All values are means ± SEM.

