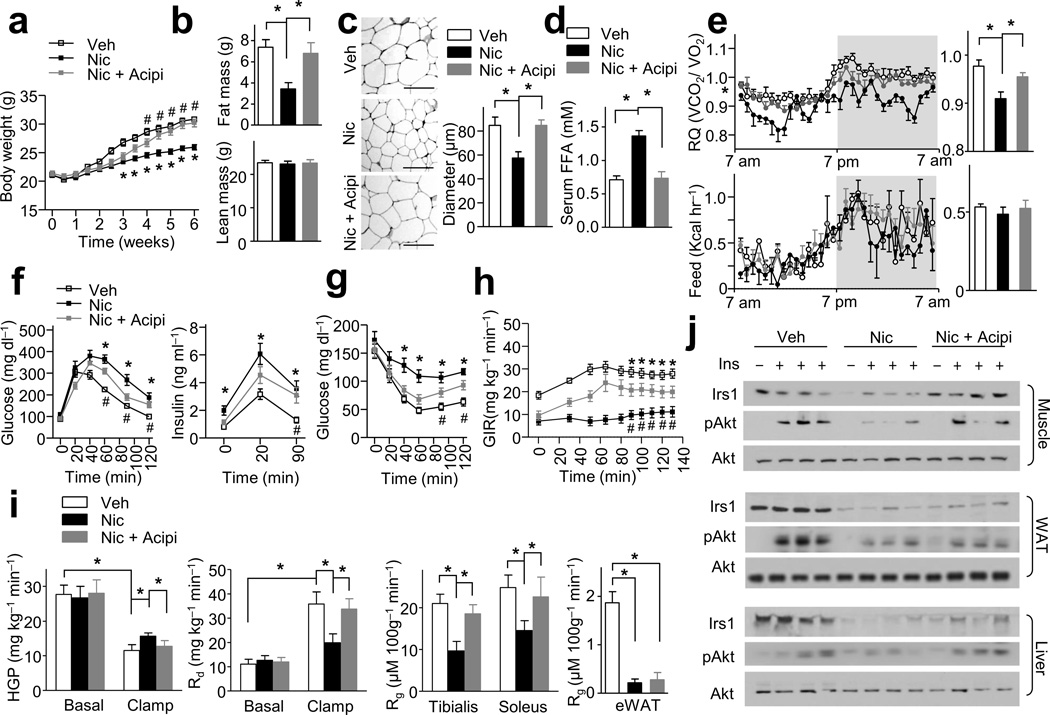
Figure 2.
Lipolysis inhibition blocks nicotine-induced IR and adiposity reduction. Wild-type mice were treated with Nic, vehicle (Veh) or Nic + acipimox (Nic + Acipi). (a) Body weight changes; n = 8–9 each. (b) Fat mass and lean mass; n = 8–9 each. (c) Representative H&E-stained WAT sections (n = 10 sections each) and the diameters of adipocytes in WAT (Scale bar, 100 µm); n = 8–9 each. (d) Serum FFA levels in insulin-perfused mice (at 40 min during ITT); n = 8 each. (e) The respiratory quotients (RQ, VCO2/VO2) and food intake (feed) during light and dark cycles, as indicated by the white and gray areas (average data in the right panels); n = 6 each. (f,h) IPGTT, insulin release, ITT data; n = 8–9 each. (i) H-E clamp (n = 8 each). Glucose infusion rate (GIR), hepatic glucose production (HGP), the rate of the disappearance (Rd), and the glucose metabolic index (Rg) in tibialis anterior and soleus muscles or eWAT. (j) Irs1 and Akt signaling in muscle, liver and WAT; n = 8 each. Significance determined by one-way ANOVA with repeated measures for the inter-assay evaluations (a,f,g,h), one-way ANOVA with Bonferroni’s post-hoc test (b,c,d,e,i), *P < 0.05 (Veh vs. Nic), #P < 0.05 (Nic vs. Nic + Acpi. All values are means ± SEM.

