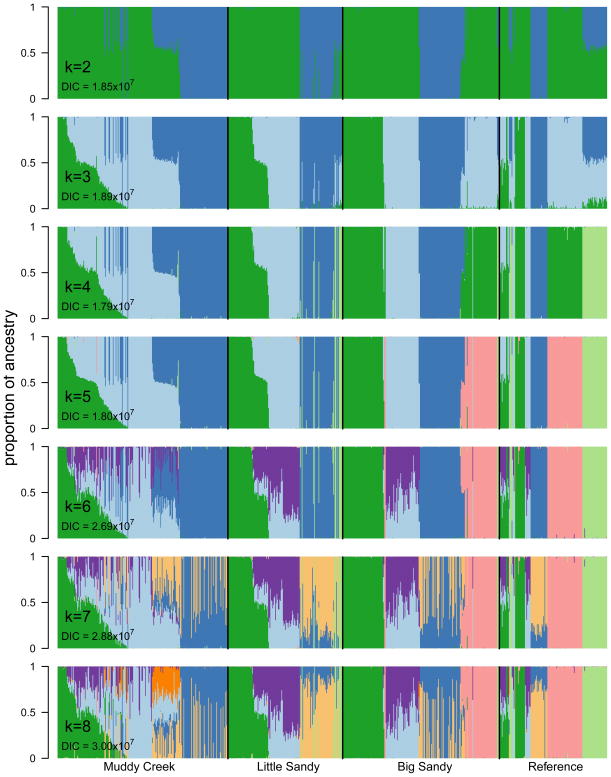
Figure 4.
Estimates of q from models with k = 2 to k = 8, with colors corresponding to the k = 5 model results (shown in greater detail in Fig. 5). We chose to use the k = 5 model because it is strongly supported by DIC, and is biologically sensible because each nominal species corresponds to a genetic cluster.

