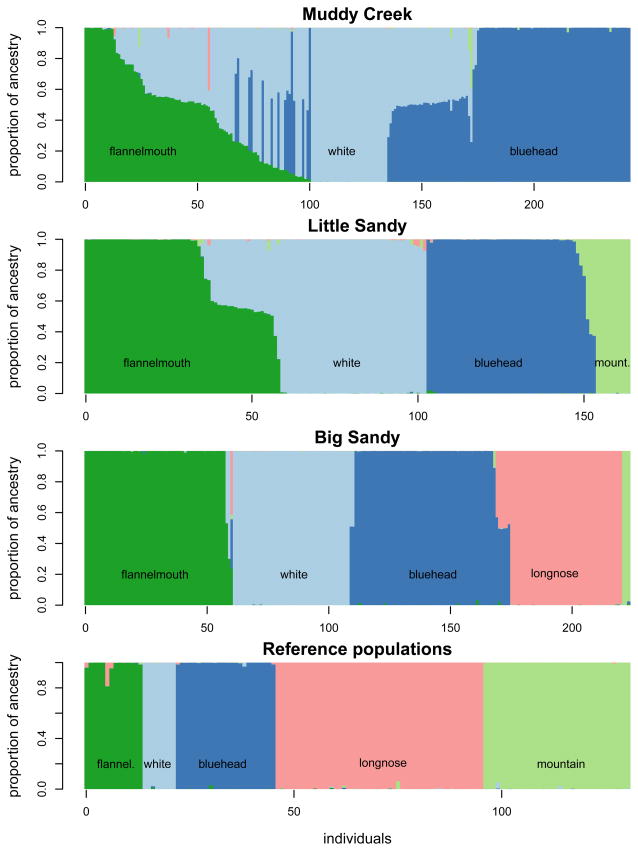
Figure 5.
Distribution of individual fish ancestries varies by species pair and across the three focal river drainages. Genetic clusters correspond to nominal species, and each is represented by a color. The proportion of ancestry from each cluster is shown by the height of each block of color; vertical bars composed of more than one color represent hybrid individuals. Estimates of q are shown sorted by focal river drainage, but the analysis was conducted for individuals from all rivers simultaneously.

