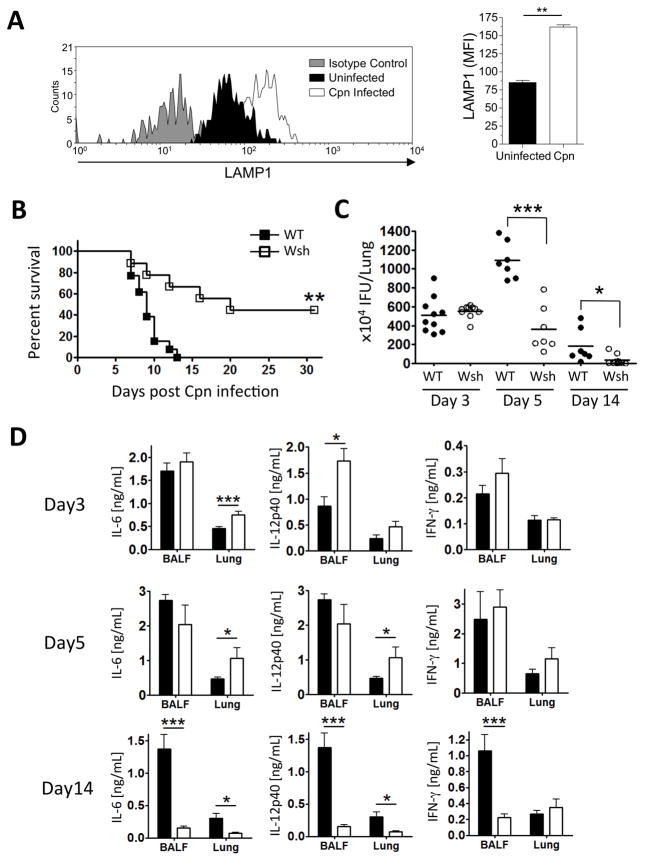
Figure 1. Wsh mice are protected from Cpn-induced mortality and Cpn propagation in the lung compared to WT.
(A) WT mice were infected with Cpn (2×10⁶ IFU) or mock infected, and sacrificed 4 days later. Single cells from the lung were prepared as described in Material and Methods. Mast cells were identified as side scatter high, c-kit IgE double positive (Supplemental Figure 1A). Surface expression levels of LAMP1 were assessed by flow cytometry and reported as the mean fluorescence intensity (MFI). (B–D) WT and Wsh mice were infected with Cpn intratracheally (5×10⁶ IFU for mortality and 2×10⁶ for others). (B) Cpn-induced mortality was observed by 31 days post Cpn inoculation. (C) Cpn IFU in the lung from Cpn-infected WT and Wsh was quantified as described in Materials and Methods. (D) BALF was collected from euthanized mice, and the lung was perfused with cold PBS and homogenized. For A, this experiment was performed one time n=5. For B, this experiment was performed twice and the data was pooled together for a total n=13 (WT) and n=10 (Wsh). For C & D the experiment was performed 3 times and the data was pooled for a total n=10 (WT and Wsh) day 3, n=7 (WT and Wsh) day 5, and n=7 (WT) n=10 (Wsh) day 14. Cytokine concentration in BALF and lung homogenates was detected by ELISA. Data are mean ±SD. Significance of differences was determined by Mann-Whitney. *P<0.05, **P<0.005, ***P<0.001.

