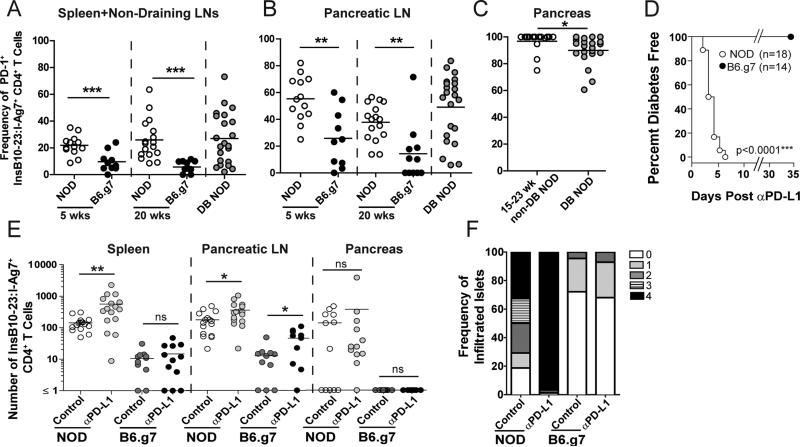
Figure 2. PD-L1 blockade differentially impacts insulin-specific CD4 T cells in NOD and B6.g7 mice.
Frequency of PD-1+ insulin-specific CD4+ T cells in NOD and B6.g7 mice (A) SPL and non-draining LNs, (B) pancLN, and (C) pancreas. (A-B) Non-diabetic NOD mice (n=13 at 5 weeks, n=17 at 20 weeks), diabetic NOD (n=22 at new onset), non-diabetic B6.g7 (n=10 at 5 weeks, n=11 at 20 weeks). Data for panels A-C are compiled from at least 10 experiments. (D) Diabetes incidence of 15 week old NOD (n=18) or B6.g7 (n=14) mice after anti-PD-L1. Data are compiled from 4 experiments. (E) Enumeration of CD44high ins-specific CD4 T cells in SPL, pancLN and pancreas of 11-16 week old NOD (n=16) or B6.g7 (n=11) mice treated with isotype control or anti-PD-L1. Data compiled from ≥3 experiments. (F) Insulitis scores from NOD (n=11) and B6.g7 (n=12) with or without anti-PD-L1. Data represent >100 islets from each group. Data are representative of ≥3 experiments.

