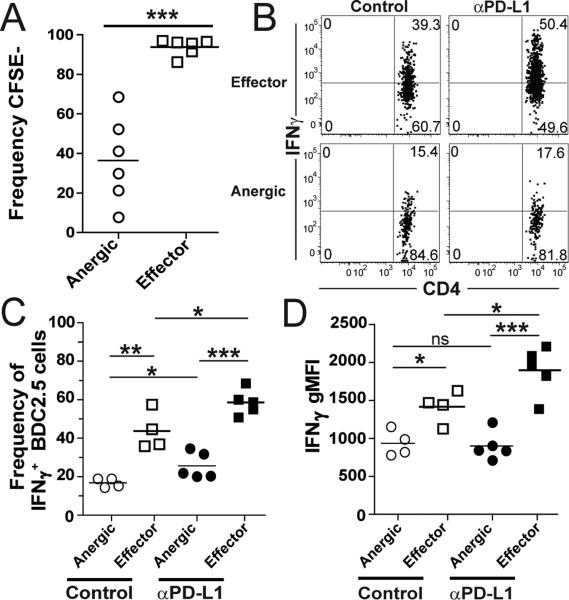
Figure 3. Blocking PD-1 preferentially induces IFNγ expression by effector but not anergic BDC2.5 T cells.
(A) Frequency of CFSE− BDC2.5 CD4 T cells in pancLN 3 weeks post transfer. (B) Concatenated FACS plots showing the frequency of IFNγ+ anergic and effector BDC2.5 cells in isotype control (n=4) and anti-PD-L1 treated mice (n=5). (C) Frequency and (D) IFNγ geometric mean fluorescence intensity (gMFI) of IFNγ+ anergic and effector BDC2.5 CD4 T cells in the pancLN 49 days post-transfer. Data are representative of 3 experiments.

