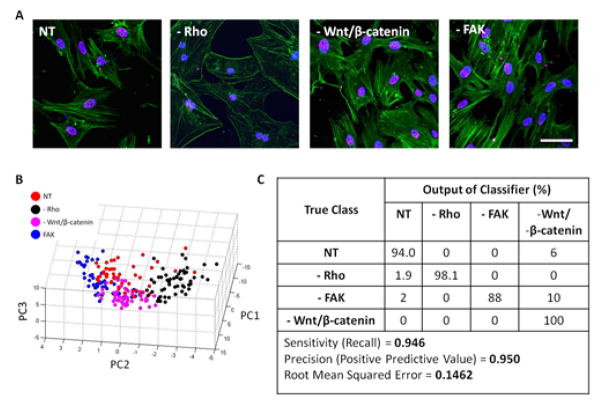
Fig. 7. Classification for hMSCs treated with different inhibitors using SC-35 organization.
Rho was specifically inhibited using 0.5 μg/ml C3 transferase (-RhoGTPase), FAK was inhibited using 1μM FAK inhibitor 14 (-FAK) and Wnt/β-catenin were both inhibited using 15 μM FH535. (A) 3 days post culturing cells in presence of inhibitors and OS media, changes in cell morphology were visualized through staining for actin using Alexa488 conjugated phalloidin, for DNA using Hoechst dye and for SC-35 organization using an anti-SC-35 primary and Alexa647 secondary antibody. (B) Subsequently, high content analysis was performed for SC-35 organization and 26 Haralick texture descriptors were evaluated. The descriptors were dimensionally reduced by PCA to principal components that account for 95% of the variance and the principal components were plotted to visualize the cell distribution. (C) Cells treated with different inhibitors were classified using J48 decision tree analysis and the output of the classifier has been presented. At least 50–52 cells were analysed for each condition. Scale bar = 10 μm.

