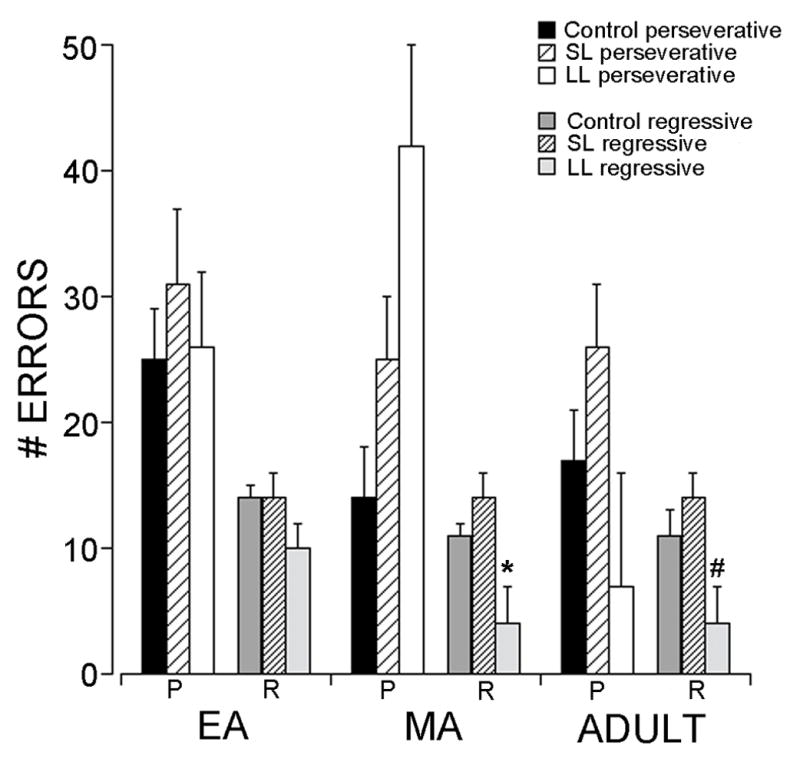
Figure 2.

Effect of stress and coping strategy on error type. Bars indicate the number of perseverative (P) and regressive (R) errors made by control, SL or LL rats of different age groups during REV. Vertical lines indicate S.E.M., *p<0.05 compared to both control and SL. #p<0.05 compared to SL.
