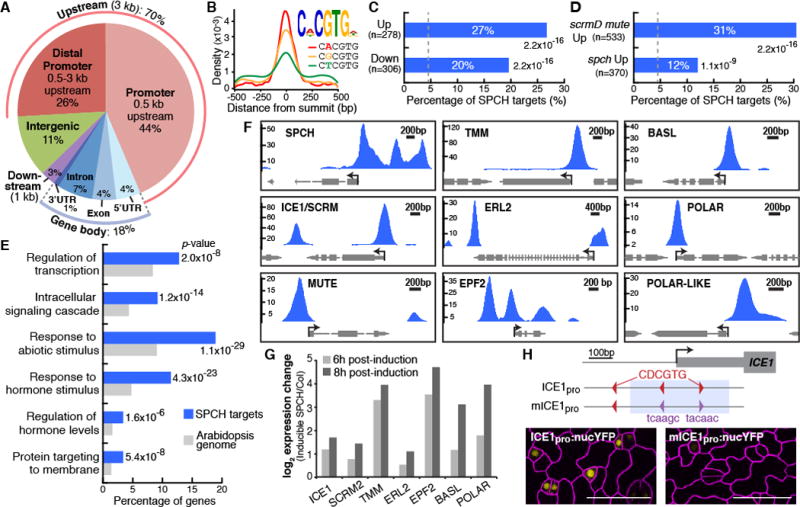
Fig. 2. Genome-wide analysis of SPCH-binding targets reveals direct roles in lineage specification and asymmetric cell divisions.

(A) Distribution of SPCH-binding peaks relative to gene structure. (B) Top-scoring motif (E-value: 7.5×10−365) and the position of its three variants in SPCH-binding peaks. (C and D) Percentage of SPCH targets among differentially-expressed genes in RNA-Seq analysis of inducible SPCH1-4A (C), and microarray analysis of meristemoid–enriched (scrmD mute) or –depleted (spch) mutants (13) (D). P-values are calculated by Fisher’s exact test. Dashed line indicates percentage by chance. (E) Select enriched GO terms of SPCH target genes. (F and G) SPCH binds and activates key stomatal regulators. ChIP-Seq profiles of select stomatal genes (F). The y-axis represents peak score (CSAR) and arrows indicate gene orientation and transcriptional start sites. Gene expression changes upon induction of SPCH in RNA-Seq analysis (G). (H) Importance of SPCH-binding motif (red) on ICE1 expression. Mutation of two motifs (purple; mICE1pro) within the SPCH-binding peak (blue shading) abrogates ICE1 expression (yellow). Confocal images of 4-dpg abaxial cotyledons have ML1pro:mCherry-RCI2A-marked cell outlines (purple). Scale bar, 40 μm.
