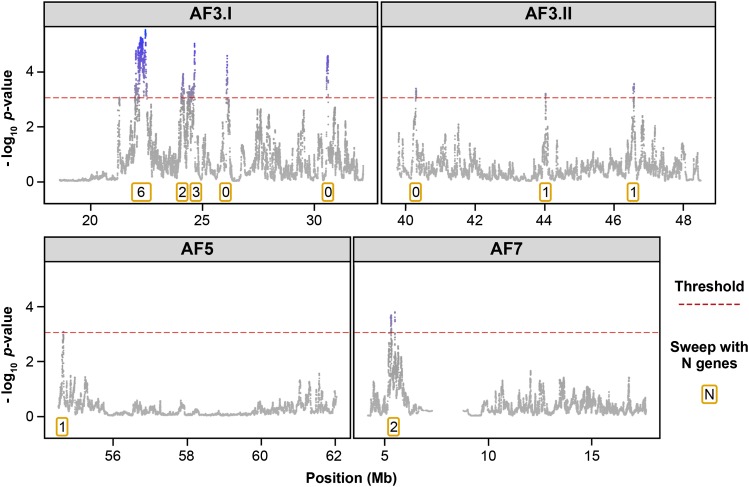
Figure 2.
HapFLK statistics profile inside each AF QTL region. The associated name of each QTL region is given at the top of each graph. Statistics are written as the -log10 of the p-value of the HapFLK test; for each sweep, the number of genes it contained is indicated in an orange box. Some QTL (AF3.I and AF3.II) colocalized with several selective sweeps, whereas others (AF5, AF7, and BMWT1) colocalized with a single selective sweep. The number of genes included in a sweep ranges from 0 to 6.

