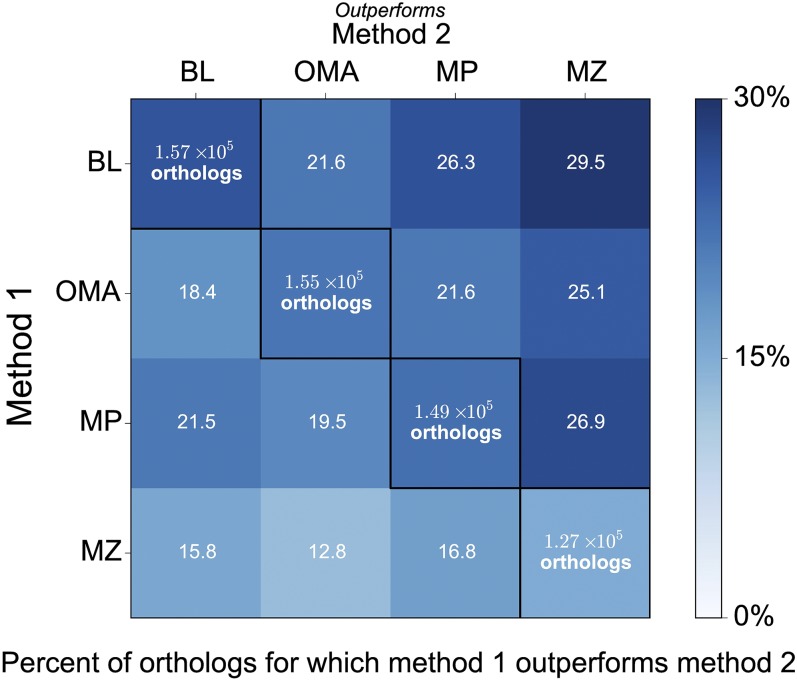
Figure 2.
Comparison of sequence identity levels between methods. Heat map of the percent of orthologs for which MultiParanoid (MP), OMA (OMA), BLAT (BL), and MultiZ (MZ) outperform one another. Performance is based on percent identity of each method’s orthologs to the human sequence. One method is considered to outperform another method if it improves percent identity by at least five percentage points. Text in diagonal cells shows the number of orthologs identified by each method, colored by the percent of orthologs for which a given method outperforms all the others.

