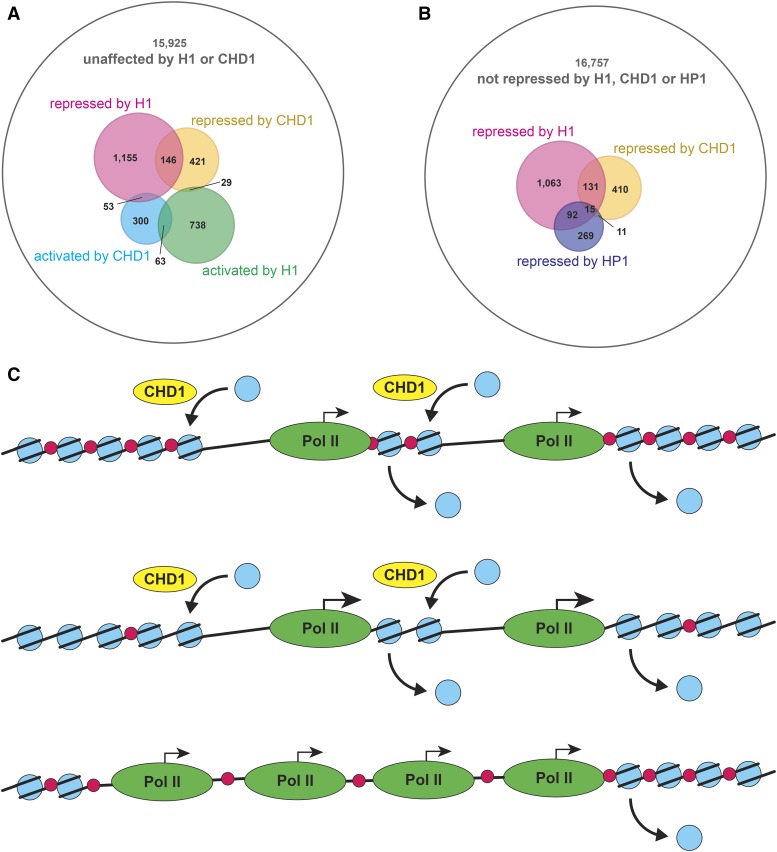
Figure 3.
Shared transcriptional repression programs of H1 and CHD1. (A) Transcripts that are demonstrated by microarray analyses to be repressed by H1 or CHD1 in Drosophila in vivo exhibit a significant overlap. Circles in the Venn diagram show all transcripts spotted on the microarray (white), upregulated (pink) or downregulated (green) in the H1 knockdown, and upregulated (yellow) or downregulated (cyan) in the Chd1 mutant. Numbers represent transcripts of each overlapping or nonoverlapping class. Note that 146 transcripts are upregulated in both the H1 knockdown and Chd1 mutant. (B) Transcripts that are demonstrated by microarray analyses to be repressed by HP1 or CHD1 in Drosophila in vivo do not exhibit a highly significant overlap. Circles in the Venn diagram show all transcripts spotted on the microarray (white), upregulated in H1 knockdown (pink), upregulated in Chd1 mutant (yellow), or upregulated in HP1 knockdown (purple). Numbers represent transcripts of each overlapping or nonoverlapping class. (C) A model for coordinate gene regulation by H1 and CHD1 at the level of transcriptional elongation by RNA polymerase 2. (Top) Wild-type chromatin. (Middle) H1-depleted chromatin. (Bottom) Chd1 mutant chromatin. Blue circle, core histone octamer; red circle, H1; yellow oval, CHD1; green oval; RNA polymerase 2. Straight arrows indicate levels of transcription by RNA polymerase 2; curved arrows indicate transcription-linked nucleosome dis-assembly and CHD1-dependent re-assembly.

