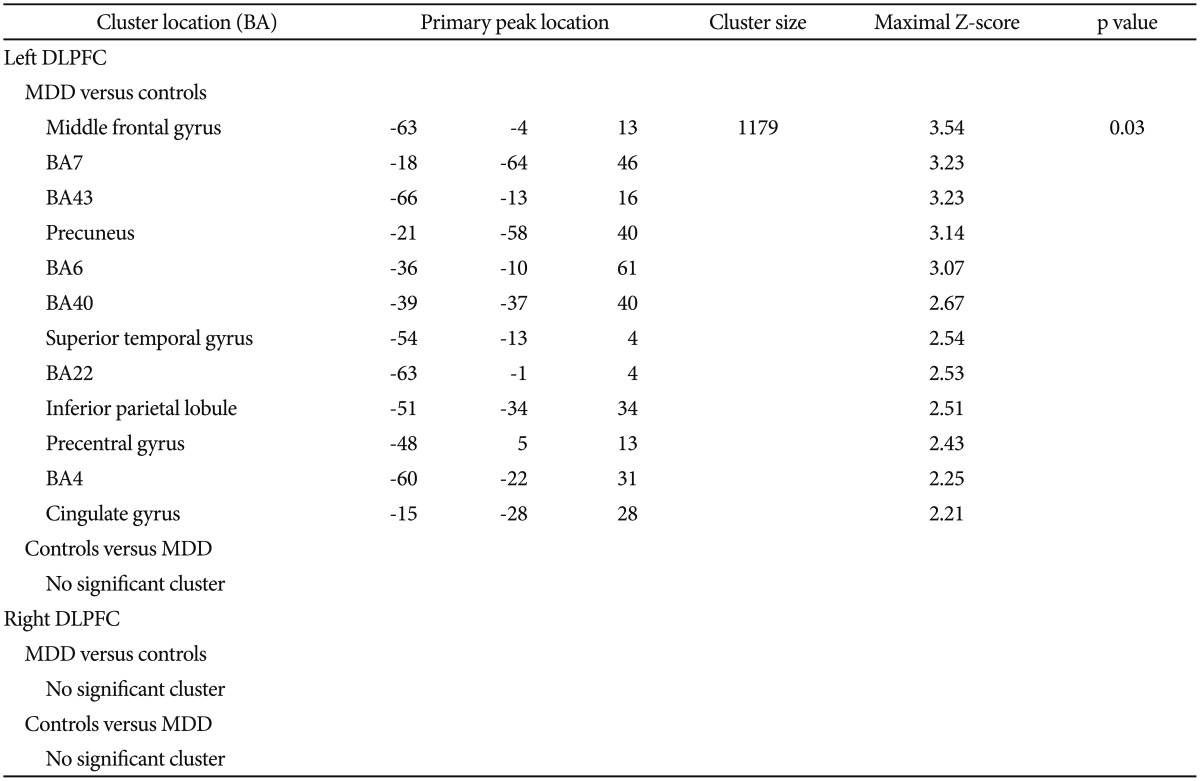
Table 2.
Significant clusters by comparing FC of left and right DLPFC in MDD subjects versus controls

Listed primary peak location is Montreal Neurological Institute spatial array coordinate system (MNI), cluster size (mm3), and significance level for each region. Height and extent thresholds of p<0.05 were used to determine significant clusters between groups. FCs: functional connectivity, MDD: major depressive disorder, BA: Broadmann's Area, DLPFC: dorsolateral prefrontal cortex
